An in depth look at the Historical Debugger in Visual Studio 2010 (Part V)
In the fifth installment of this series, I’m going to look at how to use the Historical Debugger to diagnose a Unit Test failure. The experience for using the Historical Debugger for debugging Unit Testing is somewhat similar to diagnosing a manual test failure but the steps are quit different.
Example: Debugging a Unit Test Failure
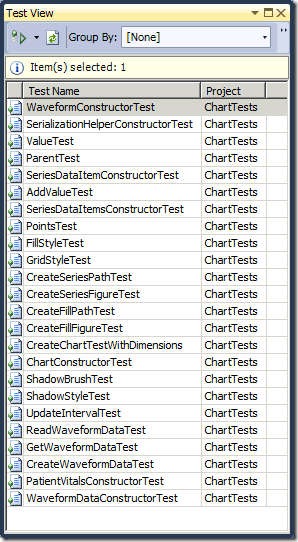
The WPF Patient Monitoring solution that I’m using for this example contains several Unit Tests that test the charting functionality in the application. You can see the list of tests in Test View window below.
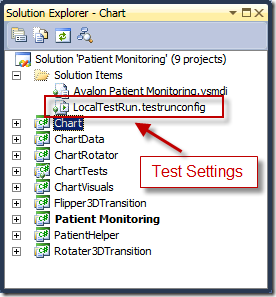
In order to enable the Historical Debugger, the first step is to configure the Test Settings by editing the *.testrunconfig file in the solution, as shown below.
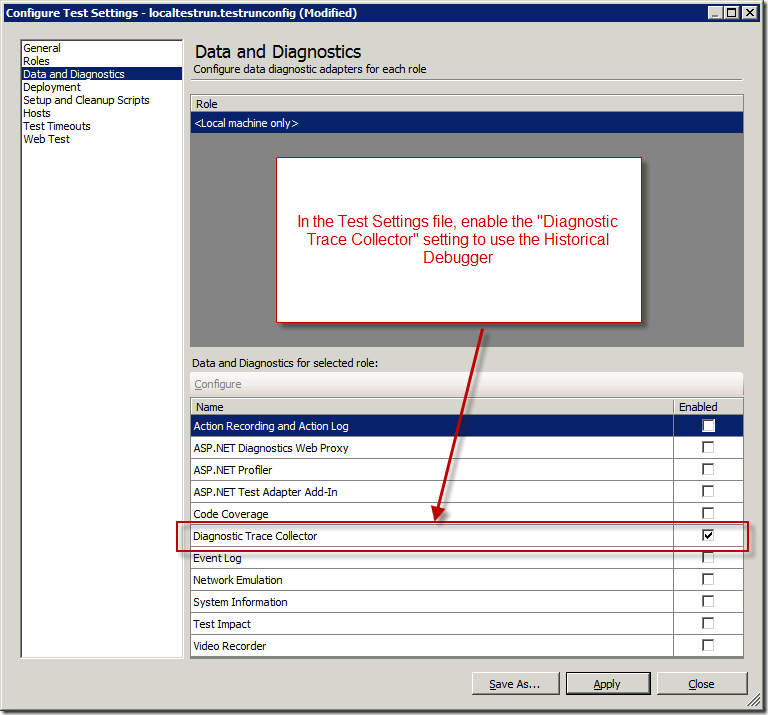
In the "Configure Test Settings" dialog, select the Data and Diagnostics tab on the left. Then, check the Diagnostic Trace Collector option to enable the Historical Debugger as shown below.
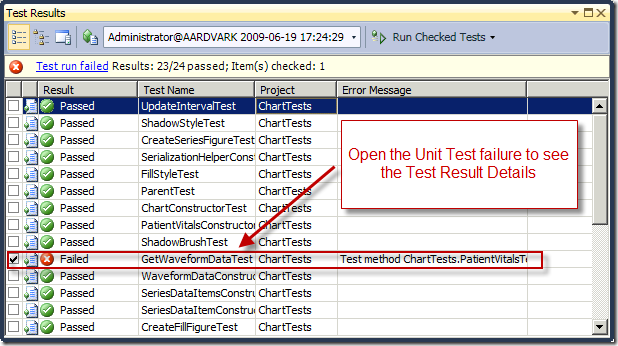
After configuring the test settings, you can run all the Unit Tests in the solution. When you run the Unit Tests and one or more tests fail, you can investigate the failure further by opening the Test Results Details for each failed Unit Test from the Tests Results window, as shown below.
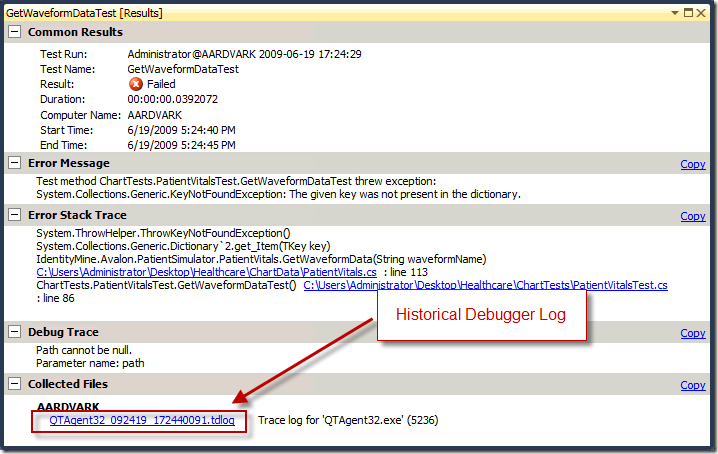
The Test Results Details window displays various information about why a test failed. Included in this window is a link to the Historical Debugger log that contains the history of what the application under test (not the test itself) was doing when the error occurred.
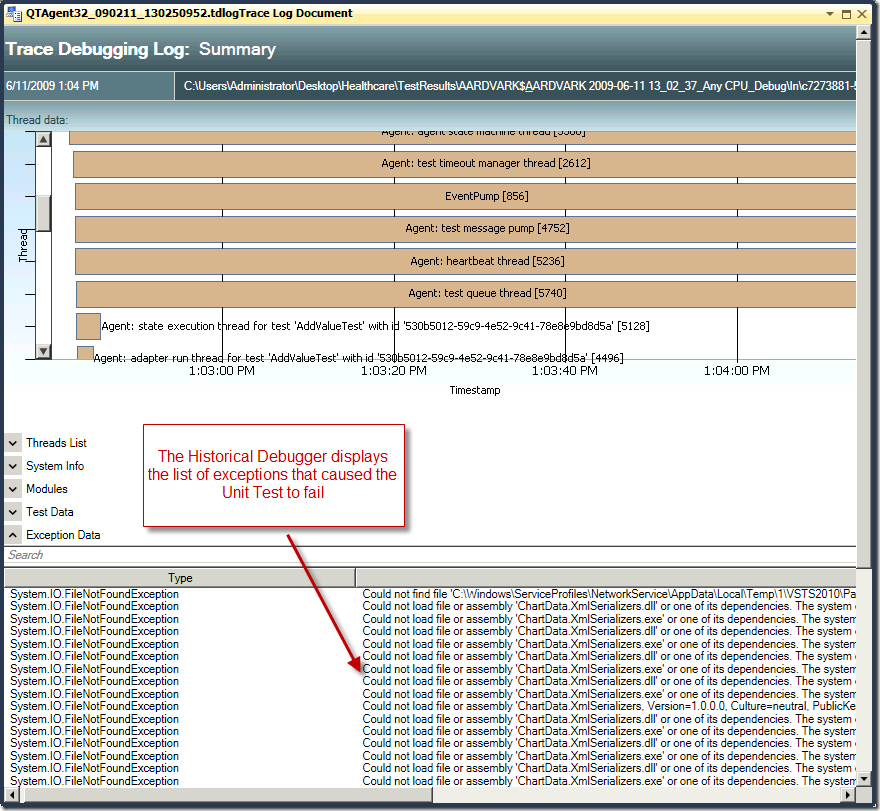
Opening the log file displays the Historical Debugger Summary page. To investigate why the test failed, a developer can double-click any of the exceptions in the Exceptions list. This will start replaying the set of events that led to the failure.
Habib Heydarian.
Comments
- Anonymous
June 20, 2009
PingBack from http://www.alvinashcraft.com/2009/06/20/dew-drop-weekend-edition-june-20-21-2009/