Trace Helper
This is the last part of the 3 part diagnostics series. This part will introduce you to a little helper utility that I wrote to make configuring the diagnostics and tracing options a lot simpler and more accessible. As discussed in the previous two blog posts in this series: Diagnosing Problems and Event Monitor everything is controlled from the Registry. Enabling and disabling tracing, the event monitor and determining what and where to trace to, all of this is controlled by Registry settings.
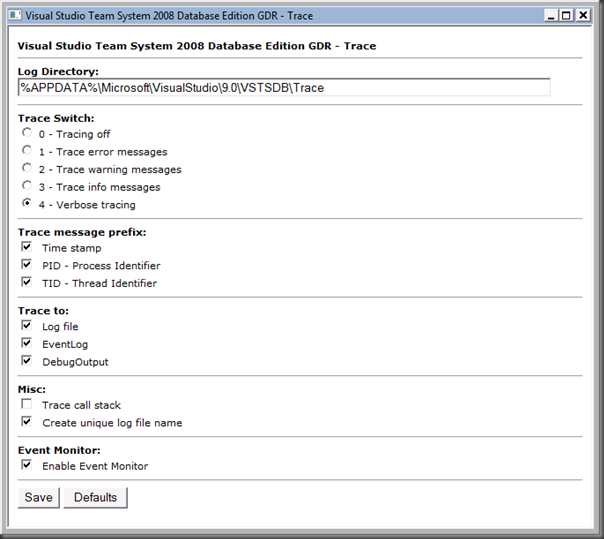
Hence the reason why created a small HTML Application that will allow you set change the settings through a simply user interface.
The end result looks like this:

You can download this utility from my DataDude SkyDrive, there is a specific version for each major release.
- Visual Studio Team Edition for Database Professionals (2005)
- Visual Studio Team System 2008 Database Edition
- Visual Studio Team System 2008 Database Edition GDR
Each link points to a .ZIP file that contains a simple .HTA file. Simply launch the .HTA file and it will start a browser session with the UI shown above.
NOTE: Make sure to restart Visual Studio after you made change to your trace settings!
This concludes the 3 part diagnostics series, I hope this was useful.
-GertD
Comments
- Anonymous
August 17, 2008
PingBack from http://hubsfunnywallpaper.cn/?p=1016