Better together: Microsoft Dynamics AX 2012 R2 and SQL Server Power View
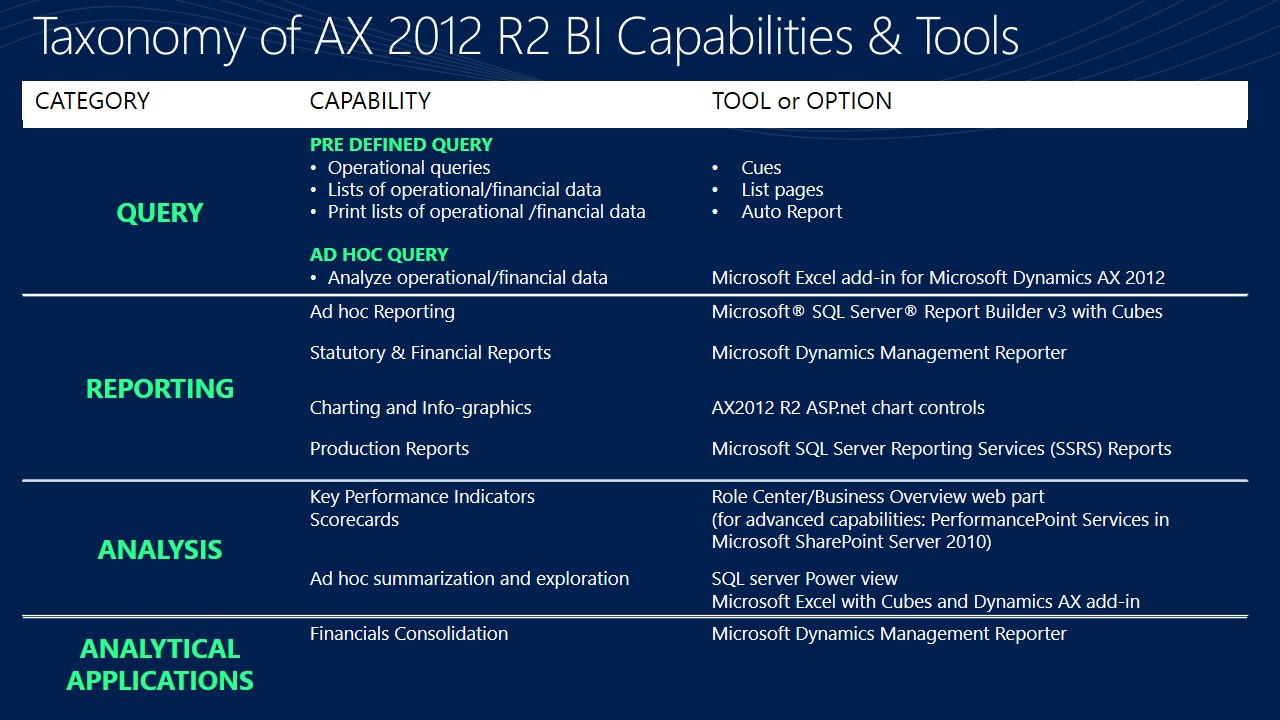
Microsoft Dynamics AX 2012 R2 utilizes the powerful capabilities of SQL Server in providing a comprehensive BI solution. A summary of Microsoft Dynamics AX 2012 R2 BI capabilities are provided below. We have categorized the capabilities along the lines adopted by BI industry literature.
Power View is an interactive, browser-based data exploration, visualization, and presentation experience and provides intuitive ad-hoc reporting for business users. Power View is a feature of SQL Server 2012 Reporting Services. In SQL Server 2012 RTM and in SP1, Power View had the ability to explore data contained in tabular BISM models (in both Excel 2013 and SQL Server Analysis Services).
As announced on November 29, SQL Server 2012 Power View for Multidimensional Models Customer Technology Preview (CTP) includes enhancements that allow Power View to explore data in Multidimensional models (a.k.a. Cubes). If you are not familiar with announcement, read the blog post here blogs.msdn.com/b/analysisservices/archive/2012/11/29/power-view-for-multidimensional-models-preview.aspx
While Dynamics AX2012 list pages provided capabilities to query and analyze operational data with the help of Excel add-in, Power view enables a user to visualize and interactively explore data behind the page in a rich graphical environment. Ad-hoc explorations created by users can be embedded within a Microsoft Dynamics AX Role center for ease of access. These explorations can also be saved directly into PowerPoint for board room quality presentations. Before we get into feature specifics, let’s review the architecture.
Architecture
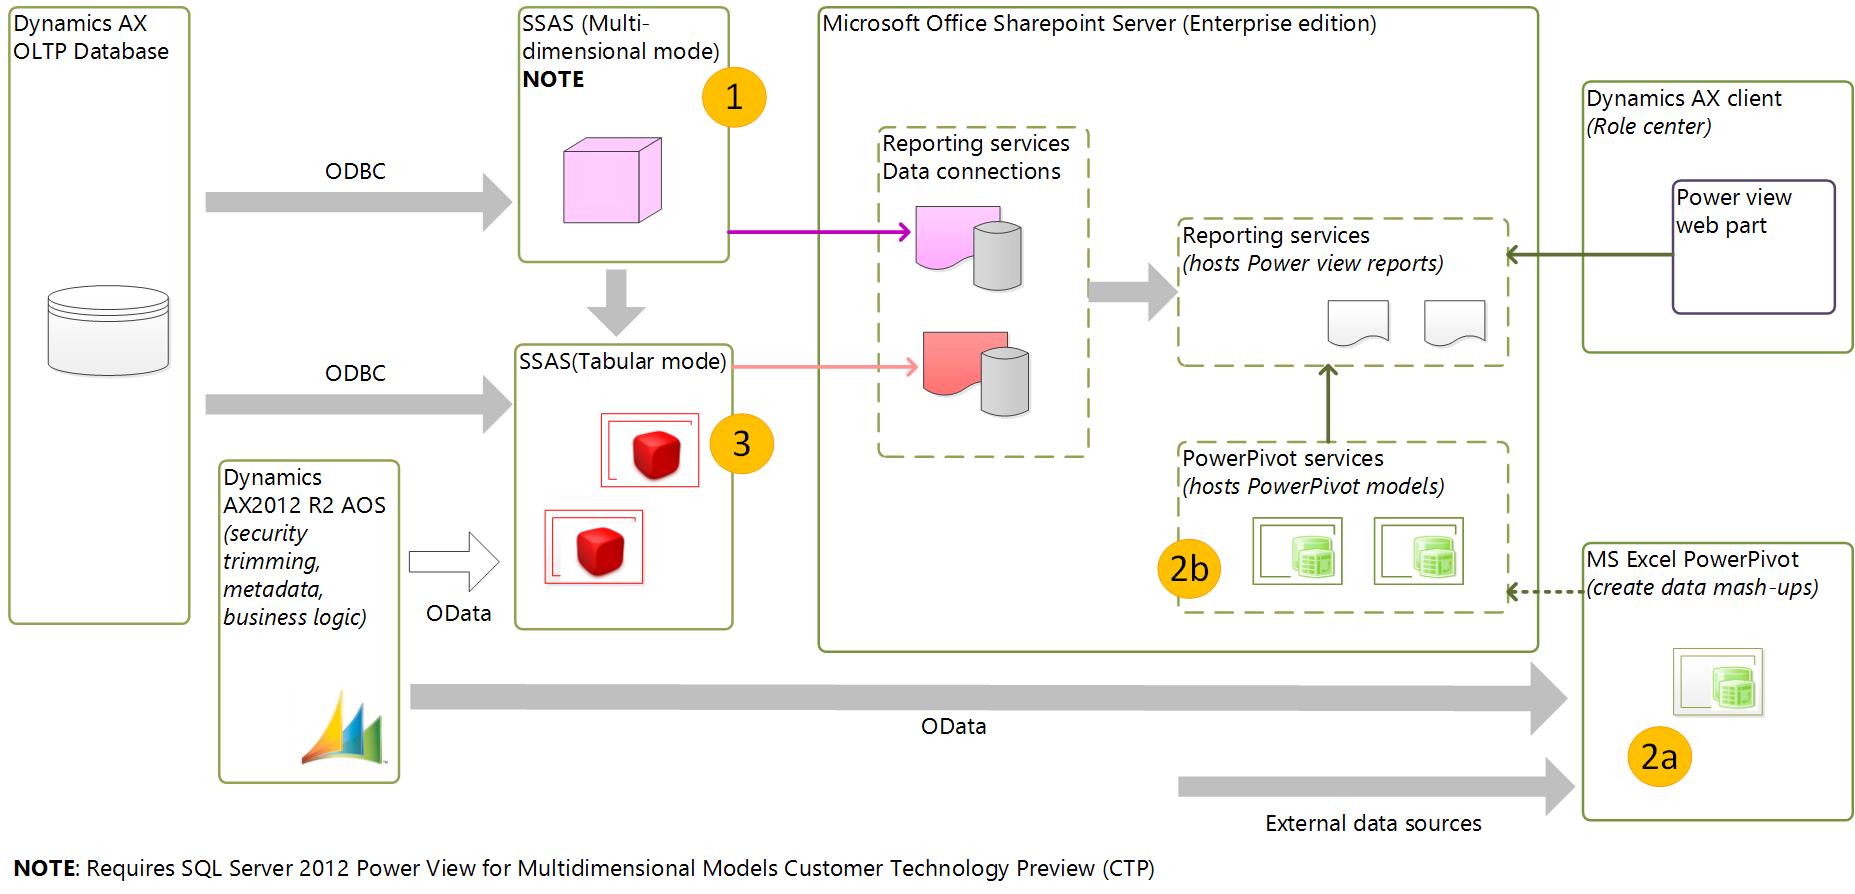
Power View can be integrated with Microsoft Dynamics AX 2012 R2 in 3 ways.
Option 1: Power View consumes data from multidimensional models
As you are aware, Microsoft Dynamics AX2012 R2 version ships with 15 pre-built cubes and this is the most compelling option when using pre-built cubes. This options requires Microsoft SQL Server 2012 With Power View For Multidimensional Models CTP. Power View over Multidimensional Models feature enables Power View to explore pre-built cubes shipped with Microsoft Dynamics AX 2012R2.
It must be said that the Microsoft SQL Server 2012 With Power View For Multidimensional Models CTP is a preview release that is not supported on production environments. So while, this capability is very compelling, you should not use this option in production environments of Microsoft Dynamics AX2012 R2 yet.
Option 2: Powerful ad-hoc data mash-up scenarios
A power user can use the PowerPivot add-in for Excel to create models and reports that combine Microsoft Dynamics AX data with external data sources. These models are commonly known as data mash-up applications. Microsoft Dynamics AX queries exposed as OData feeds are the best means of consuming data with this approach, because OData feeds ensure that Microsoft Dynamics AX security is enforced at the AOS level.
In the above diagram, path (2a) indicates this step. With PowerPivot, a user simply assembles the data required for the analysis with the help of a PowerPivot designer. After the data is assembled, the user can browse the data by using Excel PivotTable functionality. PowerPivot models can be saved to a PowerPivot gallery in SharePoint server 2010 or 2013 (Enterprise Edition). Saved PowerPivot models can be explored with Power View as indicated in (2b)
Option 3: Extend and create new data models
This is a compelling approach for developers. As a developer, you can create tabular BISM models by using SQL Server Data Tools, the Visual Studio-based developer tools for creating BI models. When creating tabular models, you can either start from a PowerPivot model created by a user (that is, create a production version of an existing model) or start from scratch. With either approach, you can create a tabular model that consumes data from Microsoft Dynamics AX by means of OData feeds or pre-built cubes.
After you develop a tabular model, you can deploy the model to the SSAS server; however, the server must be configured in tabular mode, not multi-dimensional mode.
NOTE: Starting with SQL Server 2012, an SSAS server can be configured for either multi-dimensional mode (required for hosting Microsoft Dynamics AX cubes) or tabular mode (required for hosting tabular models). An SSAS server that is in multi-dimensional mode cannot host a tabular model, and vice versa.
Now that you are familiar with the options, let’s explore ways in which Power view capability can be integrated with Microsoft Dynamics AX2012 R2.
Launching power view to Analyze data behind a list page
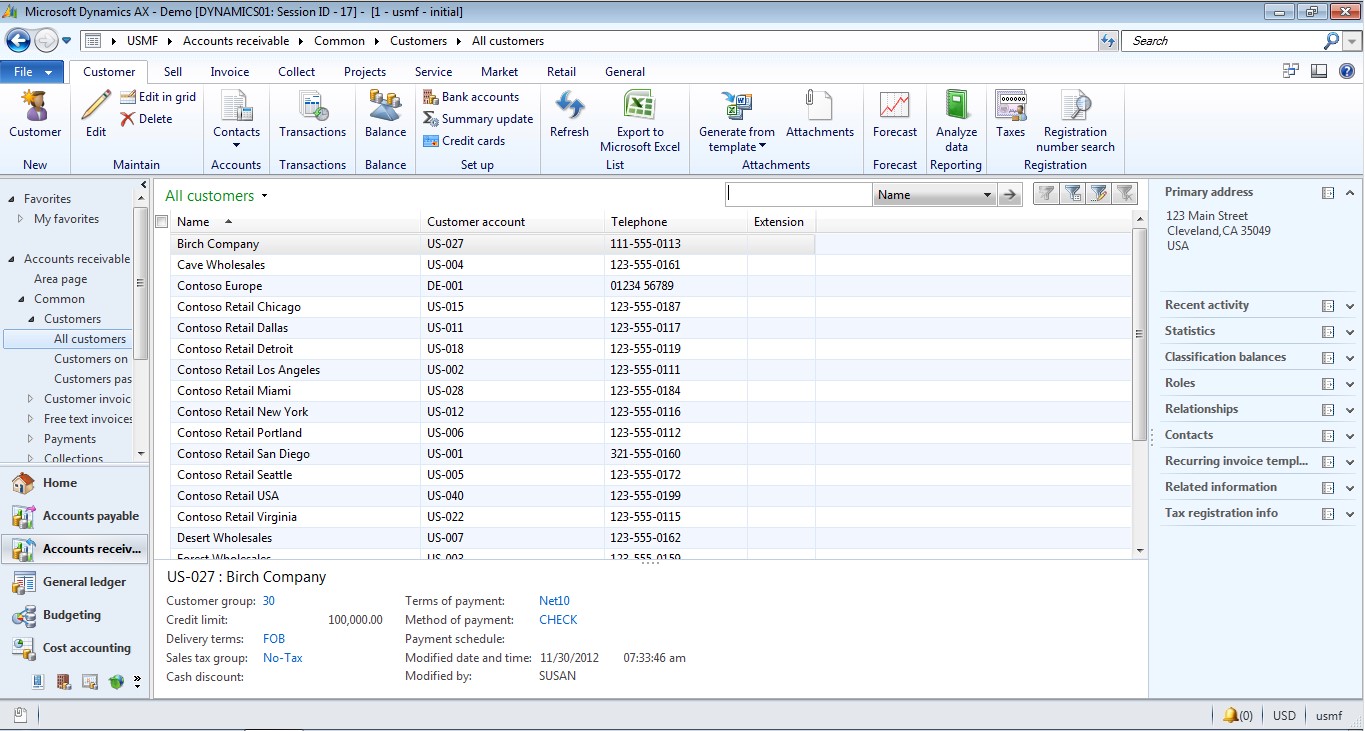
Provided you have installed Microsoft Dynamics AX2012 R2 in an environment that contains Microsoft SQL Server 2012 With Power View for Multidimensional Models CTP, user will be shown a new button in a selected set of list pages. See the green button third from right called “Analyze data”.
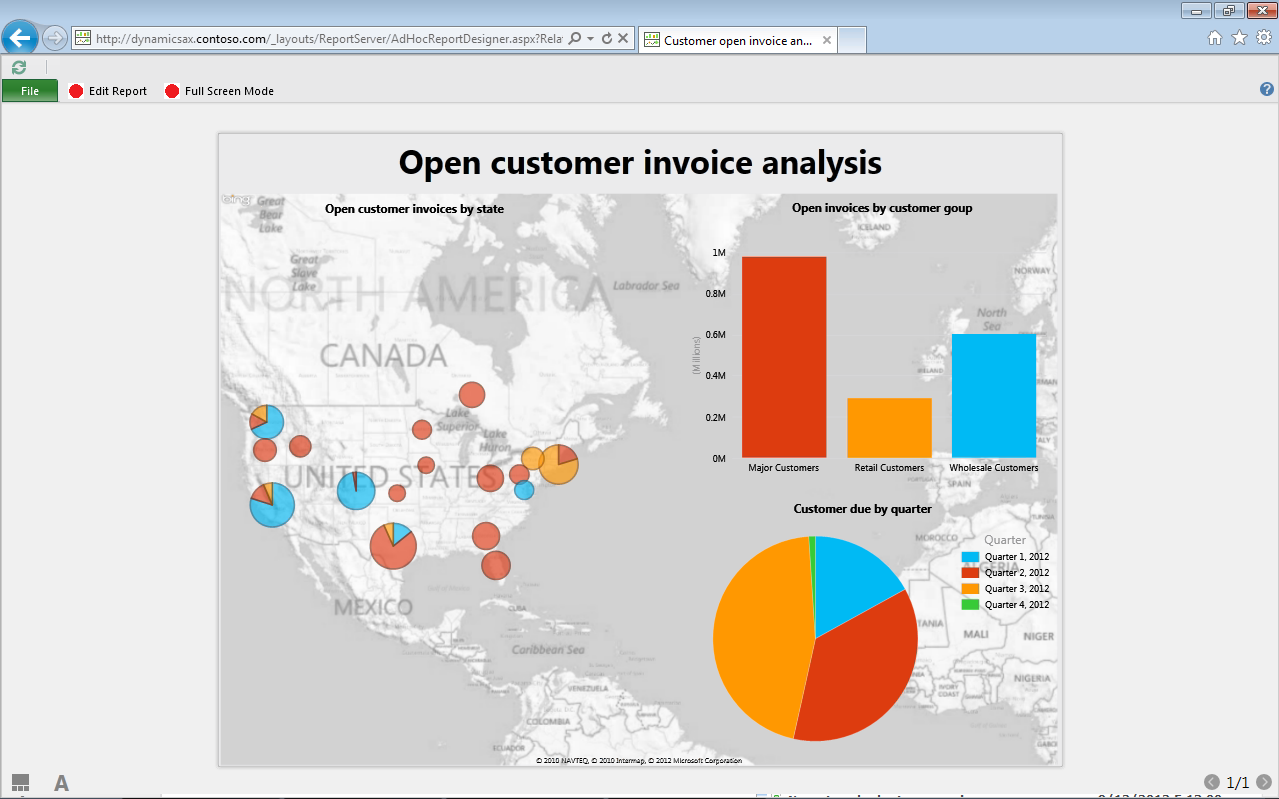
When the user selects this button, Power view will be launched with a cube that corresponds to the data shown in the page as follows.
With a few clicks user can analyze receivables from the customers shown in the list page and create a compelling Power view report utilizing the rich set of fields provided by the underlying cube.
While 7 Financial list pages within Microsoft Dynamics AX2012 R2 have the button built-in, it’s easy to add a similar button to other pages with the API provided within the product. We will explain this customization scenario in a developer focused post later.
Embedding Power View reports in a Dynamics AX 2012 R2 Role center
Microsoft Dynamics AX 2012 R2 ships with a web part to expose a Power View report in a Microsoft Dynamics AX Role Center. In addition you can also use the Page Viewer web part in SharePoint Server, and enter the URL of the Power View report. If you use the Power View web part that ships with Microsoft Dynamics AX 2012 R2, you have the ability to pass company and currency context to the underlying report so that users can launch Power View report for the corresponding company. Let's explore this option in detail.
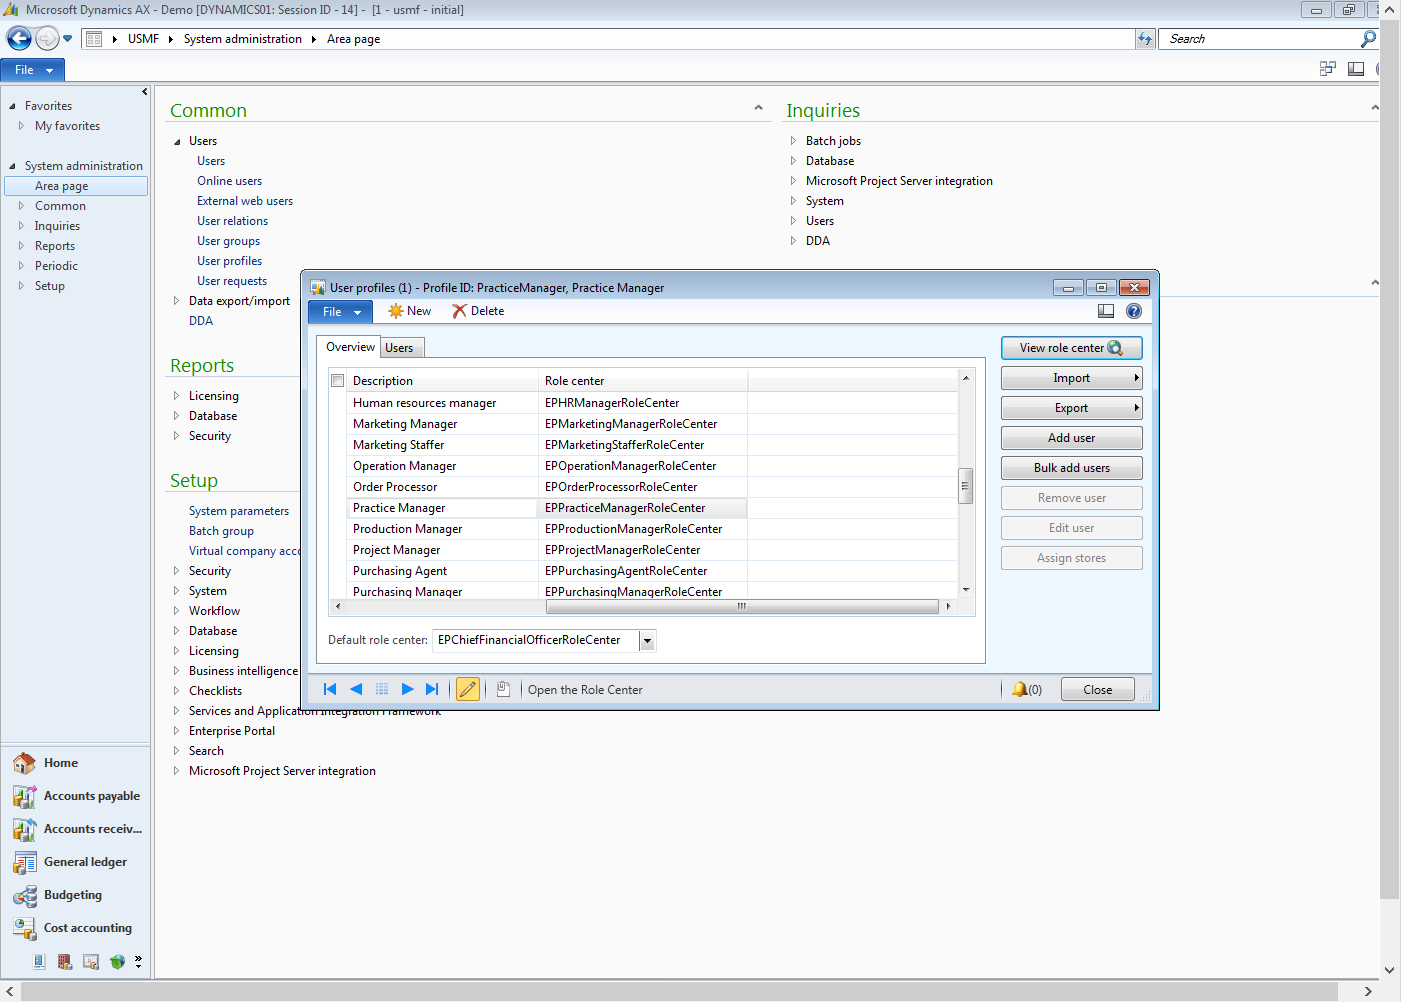
Let's launch the Practice Manager Role center of Microsoft Dynamics AX 2012 R2. If you are logged in as the administrator, you can launch the Practice Manager Role center using the user profiles form in System administration menu. Select the Practice Manager’s role center and then click button View role center.
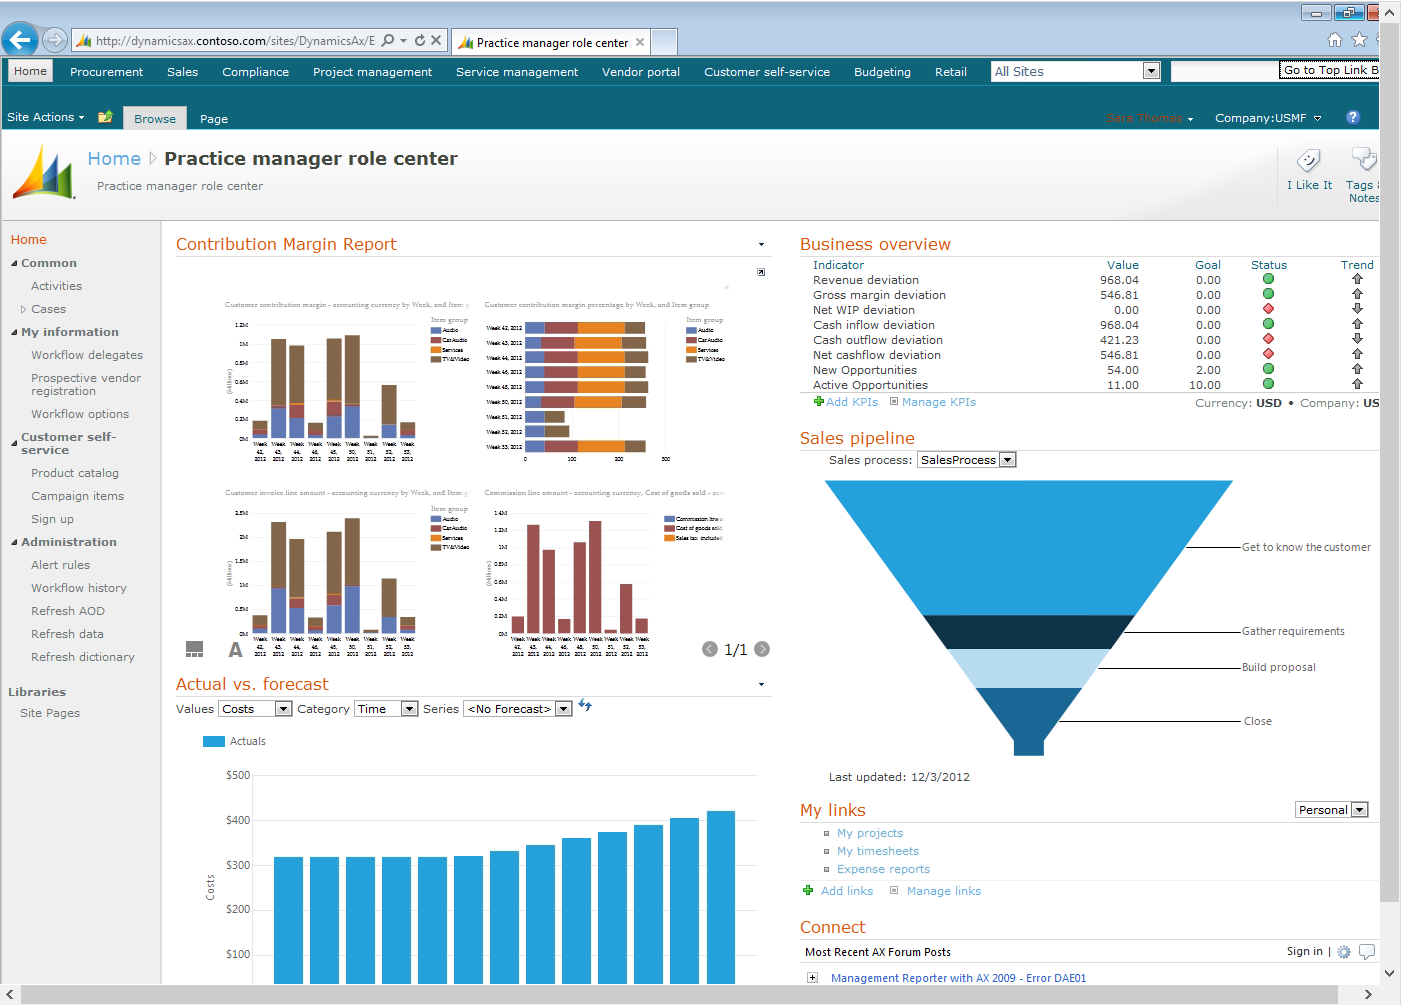
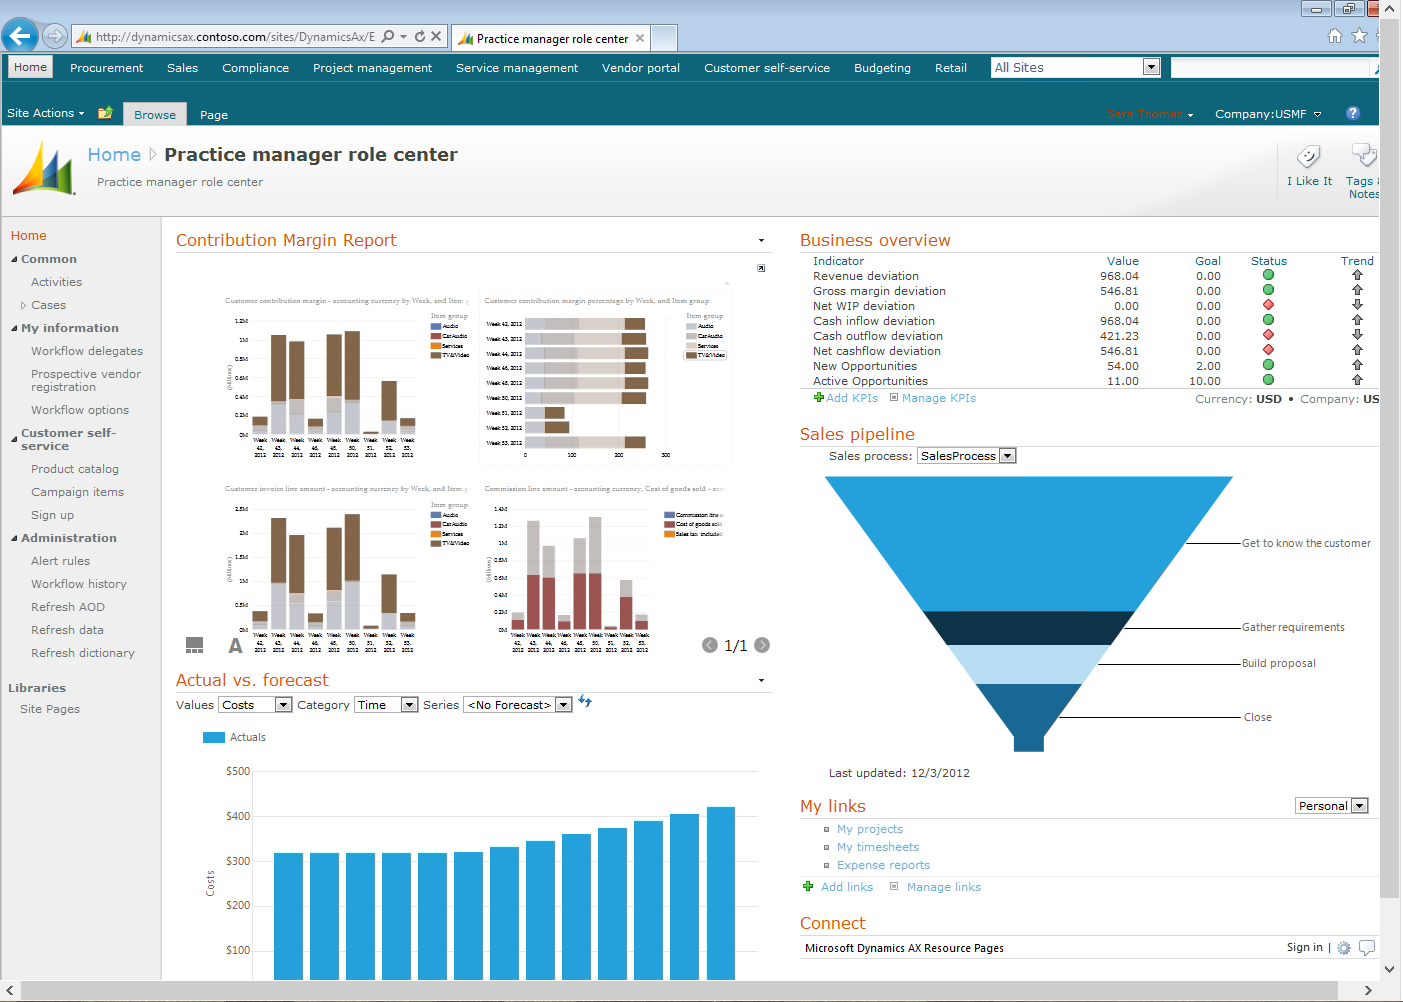
The Practice Manager’s role center will be displayed in a new browser window. If you have not customized the Practice Manager Role center, you should see the role center as follows.
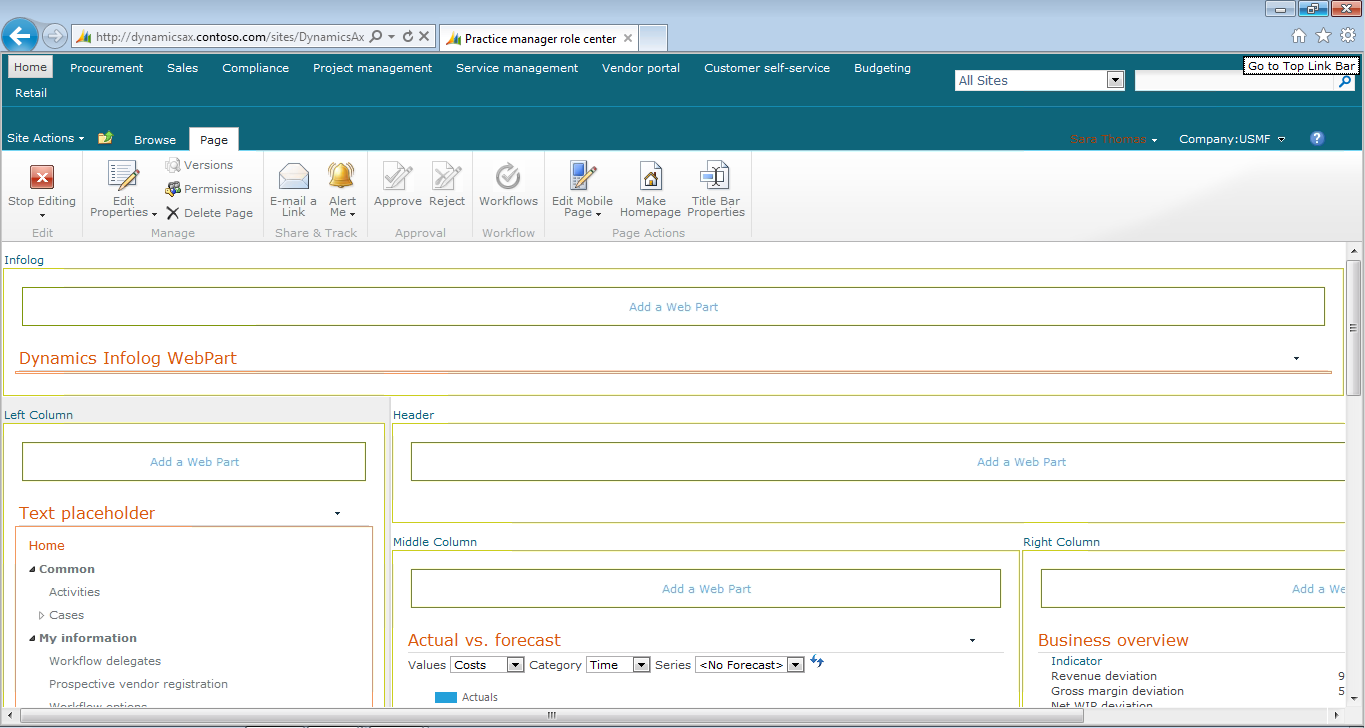
Let's embed an existing Power View report in this Role center using the Power View web part. On the Role center page, click Edit Page in the Actions list.
You can add the report into any area of the page by selecting a box anywhere on the screen. Click Add a Web Part just above the Actuals vs. forecast chart. The Web part gallery in SharePoint will be displayed as shown below. In the Add Web Parts pane, click the Microsoft Dynamics AX library. Select SQL Server Power View web part and then click Add to add the web part to the chosen location.
SQL Server Power View web part is added to the Role center page.
Now we need to configure the web part and add an existing Power View report. Point to the web part, click the down arrow, and then click Edit Web Part. You will notice the web part property page for the Power View web part as shown below. You may need to scroll your browser to the right in order to display the web part properties.
You can either enter the name of the Power View report or simply click the orange report icon to select a report from a folder within SharePoint. Navigate to the Power View reports folder (this is the folder that contains the out of the box Power View reports shipped with Microsoft Dynamics AX2012 R2). You can also pick a Power view report from any folder within your SharePoint site. If you create a custom folder and place your own reports there, you need to place the .rsds files (ie. data sources to be used by the report) within the same folder.
Let's select the contribution margin report and then enter a fixed height of 400 pixels for a better viewing experience. The report will be shown in the Role center as follows.
Now that you have seen how easy it is to add a Power View report to a Role center using the Power View web part, let's explore some of the features of the embedded Power View report.
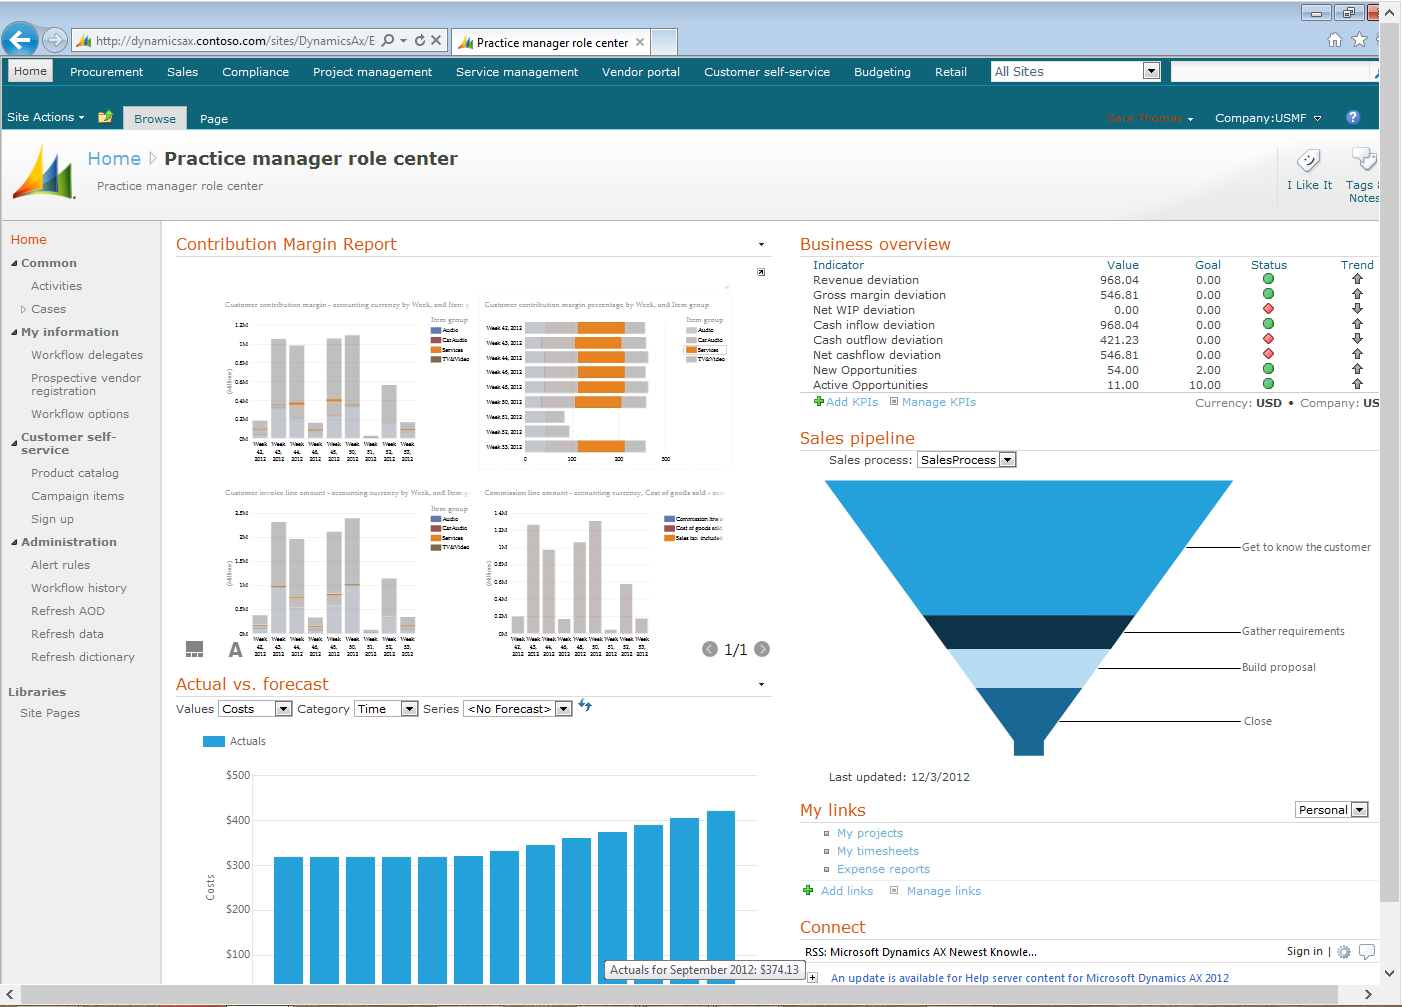
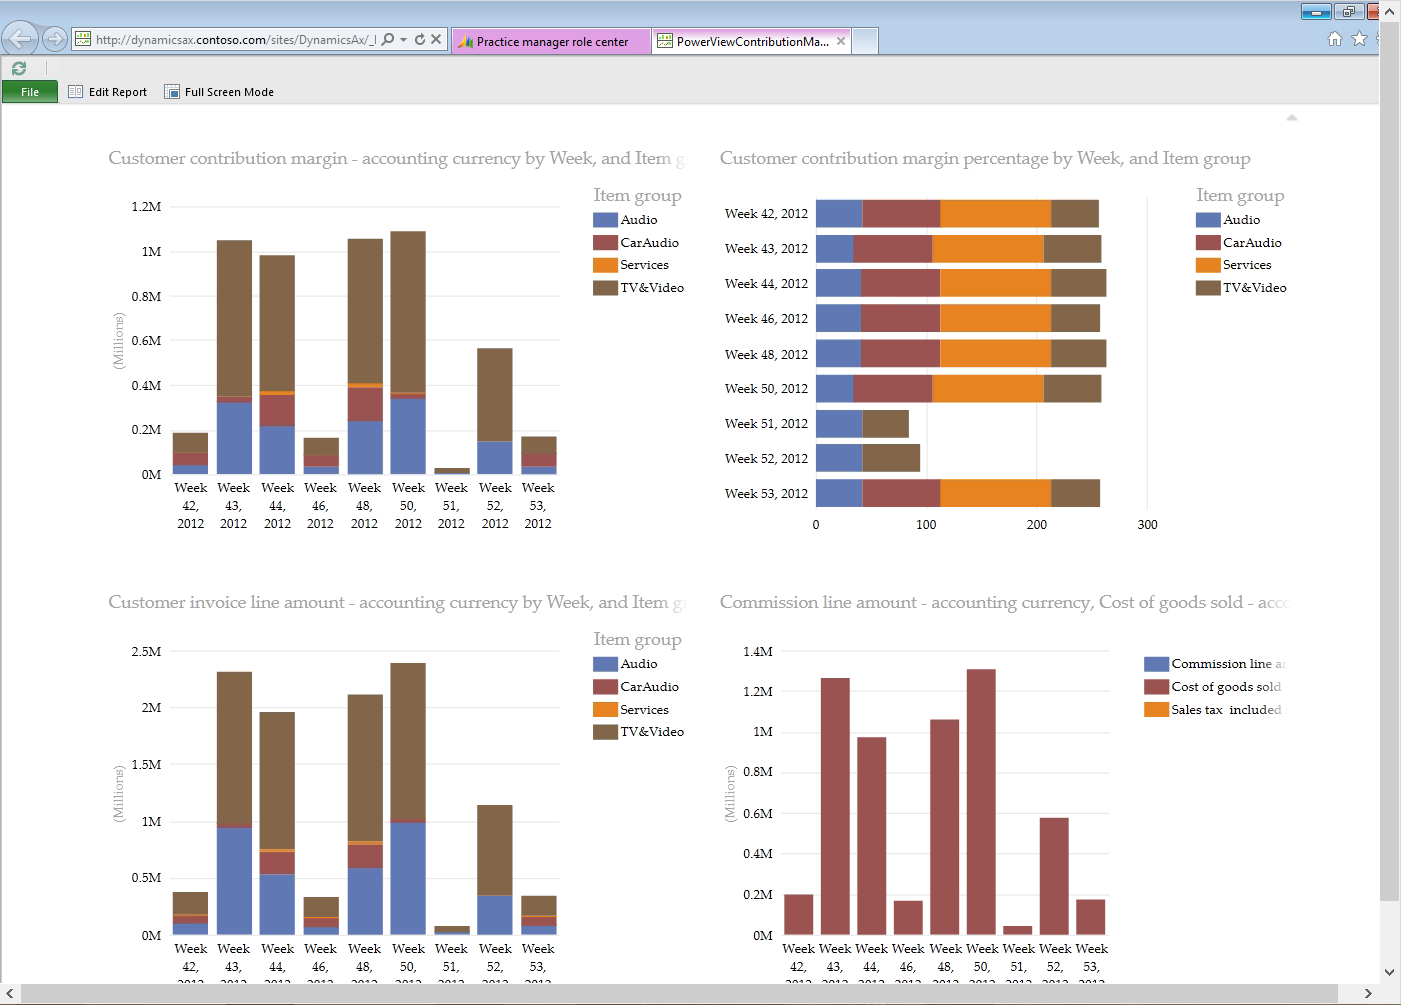
First let’s explore interactivity. Simple lick a category within the contribution margin report. Say, click on services category in the legend (Orange color) and all the charts filter to show data for Services category.
Next, click TV & Video category (brown) and all the charts are filtered to show TV & video category.
If you want to expand a chart within the report, simply hold the mouse on top of the chart and a context menu will appear on the top left. Select the option to expand the chart and only that chart will be shown within the web part as follows. Holding the mouse on top of the chart will also highlight the option to restore the chart to its original size.
You can launch the report in a separate browser window to view the report in full screen and/or make any changes. Select the arrow on the top left of the web part to launch the report in a separate browser window.
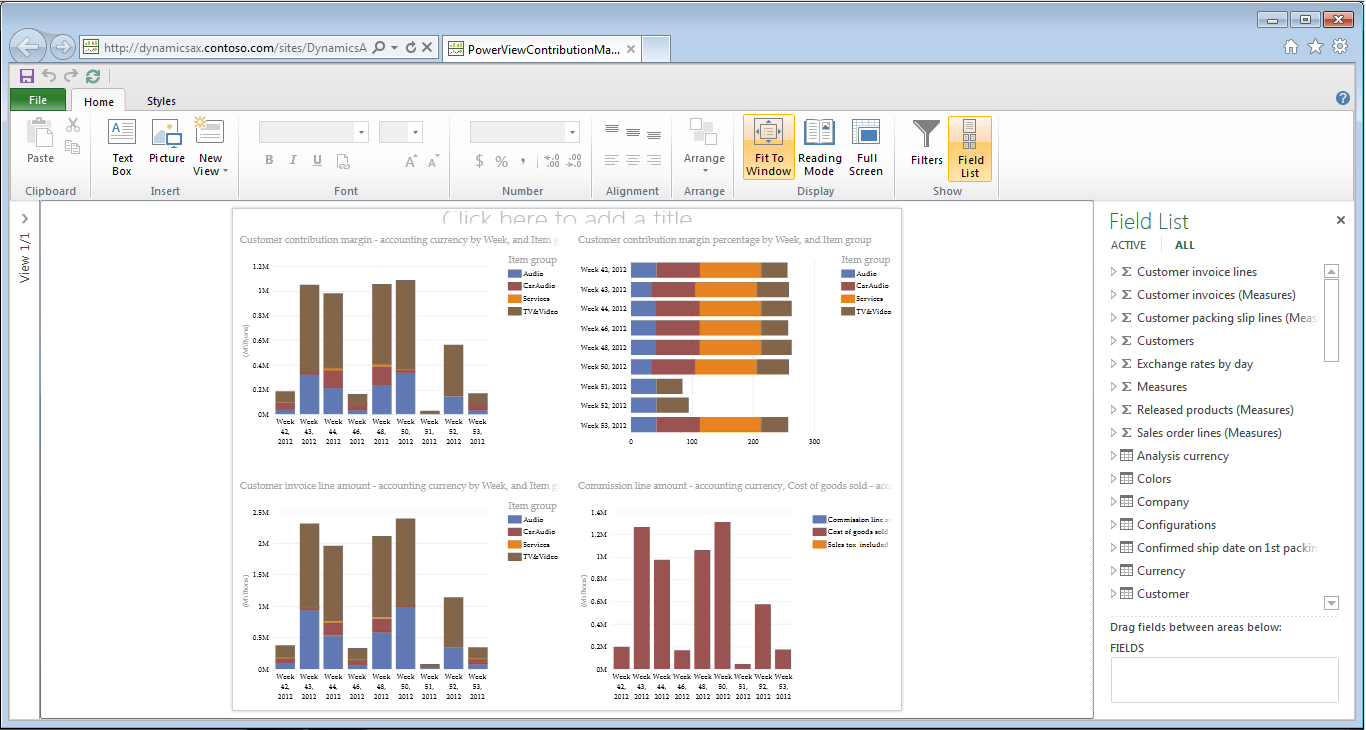
To edit the report, click Edit Report in the upper-left corner. The field list tab on the right will show the rich set of fields available for analysis – as you may have guessed, these are the fields present in pre-built cubes.
You probably know that Microsoft Dynamics AX cubes are multi-company and multi-currency. However, a Role center (just as the Microsoft Dynamics AX client) is company and currency specific. You can switch the currency and company context from within the role center. Web part applies the company and currency context to the Power View report such that the Power view report will only show data corresponding to the current company and in the same currency.
The web part also adjusts the report to fit into height and width of the frame specified in the web part properties. As you resize the browser window or the size of the web part, the Power view report within the part adjusts the size accordingly.
Conclusion
As you have seen above, Microsoft Dynamics AX2012 R2 adds a powerful analysis capability with the help of SQL Server power view.
With the announcement of Microsoft SQL Server 2012 With Power View For Multidimensional Models CTP, pre-built cubes shipped with Microsoft Dynamics AX2012 R2 can be explored with Power view. Leveraging this capability, we have enabled two features: to analyze data behind a list page and to embed the power view reports into a role center.
In a future post we will dig deeper into developer topics, until then, we encourage you to try this feature and provide us with feedback via connect.
Comments
- Anonymous
February 01, 2013
Hi, I am unable to get the graphs only framework of web part is showing. I am using USMF company. Is there anything i am missing? Regards, Sridhar
