Ranges as Filters for Dates
Scenario
We may have data across months, and we’d like to, at times, focus on the next 3 months, the following quarter, or the first 6 months… or similar, i.e. how many people between 20-30 years old, or 30-40, etc. How do we define these ranges, and how can we visualize them?
HowTo
Let’s say we have a dataset measuring costs for projects across two years. We’d like to have ranges for:
- All months before today.
- This current month.
- The next 3 months.
- The following 3 months.
- The next year.
These calculations will be needed in the “Dates” table. First we need a column to calculate the buckets (in this case, the number of months from today):

Then, another column to calculate the actual range based on the buckets (these could be combined):
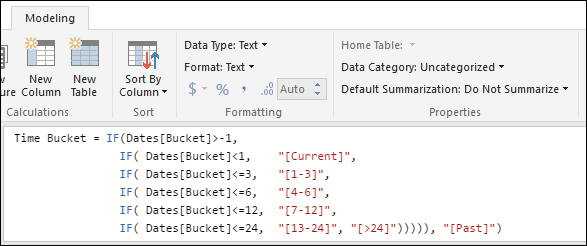
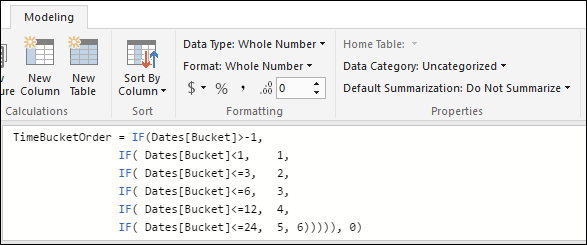
Finally, a column that we’ll use to order the ranges when we display them (on a logical order that makes sense, and not alphabetically):
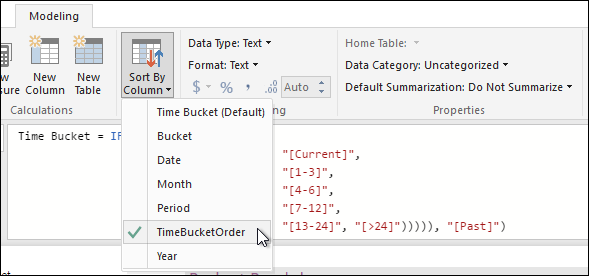
When we select the “Time Bucket” column, we can use the “Sort By Column” option to choose “TimeBucketOrder”:
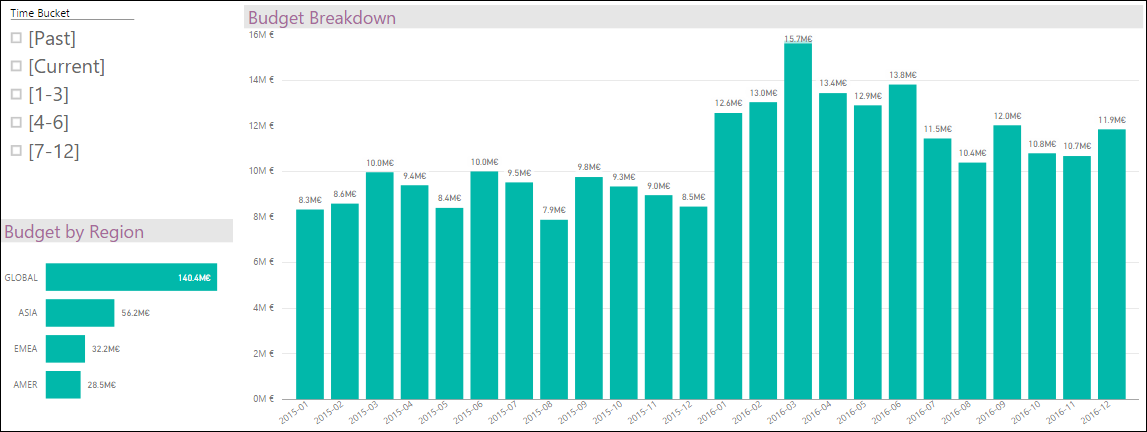
Now we can create visualizations like these:
Results
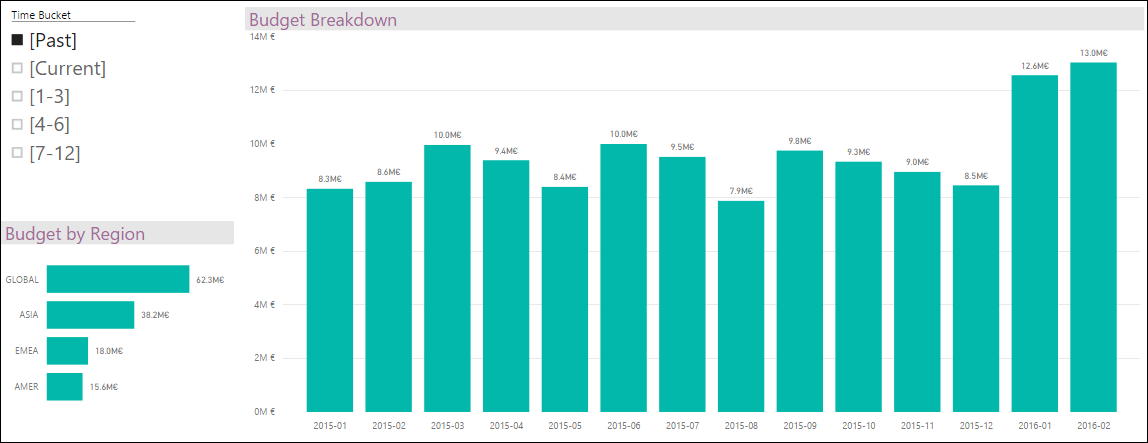
If we filter by “Past”, will take all months before the current one:
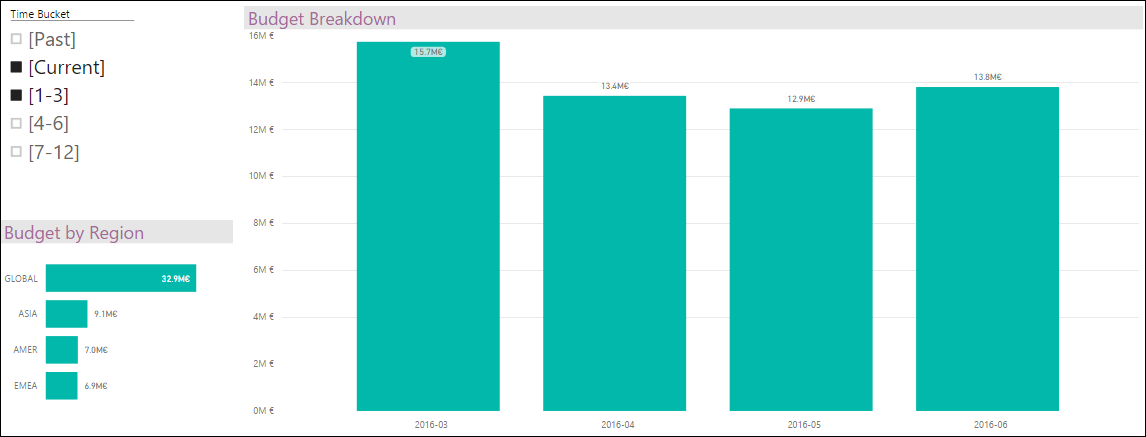
Current and next quarter:
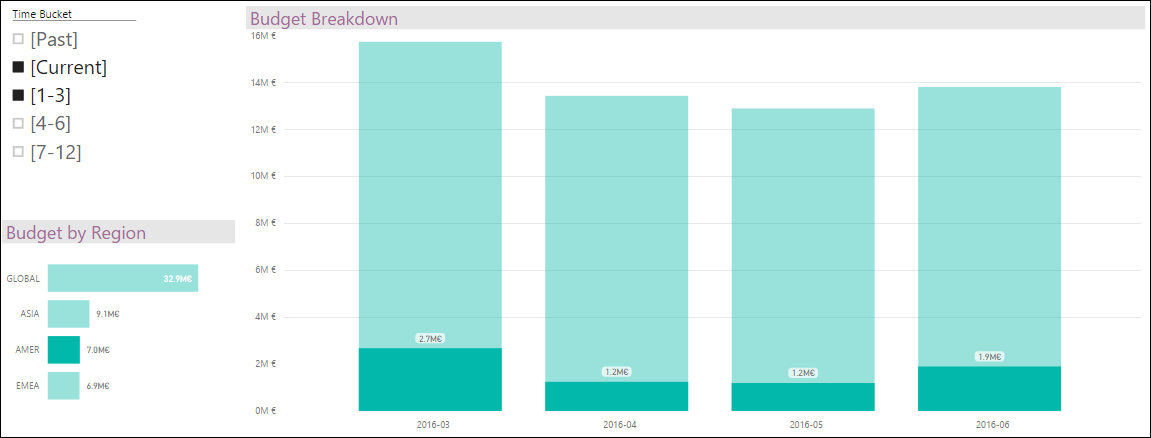
And if we select America’s region, we highlight the values for that region on the selected range of dates:
Related Posts
- “Grouping in Ranges/Bands” for ways to simplify a bit this scenario.
- “Use Ranges/Bands for measuring Frequencies and visualizing Empirical Distributions”.