The Central Limit theorem, Normal Distribution and Poker hand distributions
In Graph Poker Hand Distributions I showed some code to graph poker hands and the distributions of their values: e.g. how many times a Pair, Full House, etc. were found in sets of one thousand random hands.
It shows that the probability of a Pair is roughly 42% of deals. A royal flush was .000169%, pretty rare
In that post, there’s a section that says:
/* add a "/" at the beginning of this line to use alternate code
// insert code here later
/*/
chart.DataSource = dictHandValues;
series1.ChartType = SeriesChartType.Bar;
series1.XValueMember = "Key";
series1.YValueMembers = "Value";
chartArea.AxisX.Interval = 1;
chartArea.AxisY.LabelStyle.Format = "#,#";
//*/
Insert these lines where it says “insert code here”:
chart.DataSource = dictPairDist;
series1.ChartType = SeriesChartType.Column;
series1.XValueMember = "Key";
series1.YValueMembers = "Value";
now you can add a “/” at the beginning of the line that says add a “/”
That change causes the inserted lines not to be a comment any more and the original chart datasource code to be commented out.
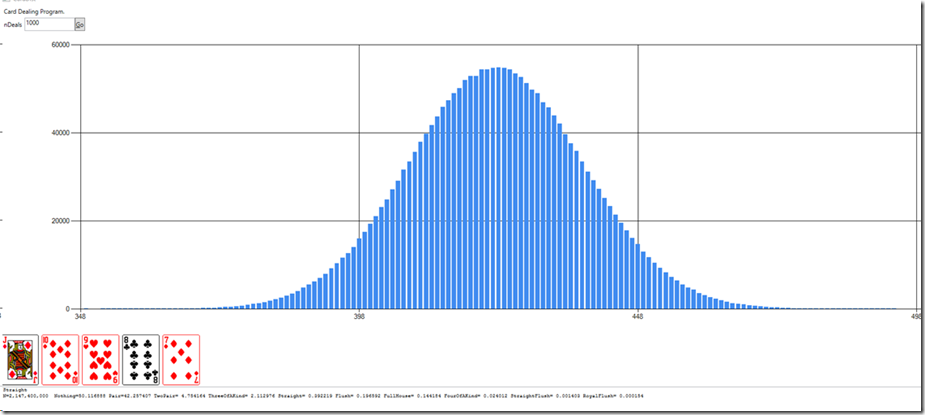
The new Datasource is the dictPairDist accumulates the number of pairs found in batches of 1000 deals: e.g. if the first batch of 1000 deals might get 400 pairs, so dictPairDist[400] == 1. Subsequent batches of 1000 deals with 400 pairs will increment that value.
You’ve probably heard of a bell curve, or a Normal Distribution.
The Law of Large Numbers says that if you do an experiment (e.g. flip a coin) a large enough number of times, the average number of “heads” will be the expected value: e.g 50%
The Central Limit Theorem says that when independent random variables are added their sum tends to be a bell curve. If you define an experiment to be the number of heads from flipping a coin 1000 times, the expected value is 500 heads, but there will be some experiments where there are 499 heads, and even 300. The distribution of the actual value of the number of heads will be a bell curve with the center around the mean expected value (500). Similarly the number of pairs found in a batch of 1000 deals will be a normal curve centered around the value 420.
A number called the Standard Deviation indicates the variation of a set of values. About 68% of values in a normal distribution fall within one standard deviation of the expected value. 95% are within 2 standard deviations, and 99.7% are within three standard deviations.
