How It Works: SQL Server Deadlock Trace Flag 1222 Output
The trace flag 1222 can be very powerful and helpful in tracking down the cause of a deadlock when used correctly.
This week I was tracking down a blocking situation, which I expected the lock monitor to resolve as a deadlock. The test in question is designed to cause large amounts of deadlocks in order to stress the deadlock detection and resolution code paths. I was looking to see if the problem was an undetected deadlock that lock monitor was struggling with or something else, and to my surprise I found it was the trace flag –T1222.
When you enable –T1222 the output of the XML deadlock information (usually seen in trace facilities) is written to the error log. This adds overhead for logging which has the impact of slowing down lock monitor and in turn causing longer blocking scenarios. The design does off-load the output activity to background workers so the lock monitor does not have to participate in outputting the results and can remain focused on detection and resolution activities.
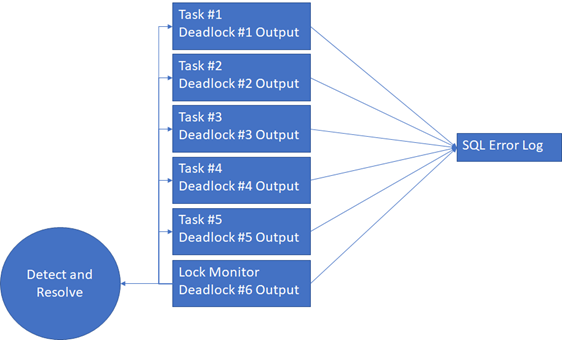
The key is the background tasks used to output the XML deadlock information. SQL Server limits the background tasks to a total of five (5) tasks to avoid flooding the scheduler with deadlock output tasks. Once 5 tasks are active the 6th, … output from lock monitor happens inline (lock monitor outputs the results to the error log, without performing object name resolutions, I.E. unknown where the tasks are allowed to resolve object names.) When a background task complete, lock monitor can leverage is again for the next output request.
The contention point appears at the error log. Each line of the output is protected so multiple tasks can’t write at the exact same time. When the 5 background tasks are actively writing the lock monitor has to participate with those tasks for I/O bandwidth to the error log.
In my case the test was generating large numbers of deadlocks and flooding the log with –T1222 output. The test was using all 5 background tasks and the lock monitor to produce the output and the I/O path to the error log was saturated. The longer it takes lock monitor to output the results the less time it has for detecting and resolving deadlocks leading to the reason the deadlocks were being resolved slower than I expected.
While this is a pretty unusual scenario, I wanted to highlight how the trace flag works so you can use appropriately. As soon as I issued the dbcc traceoff(1222,-1) my server returned to expected behavior. Lock monitor still detects and resolves deadlocks at a much faster rate because the lock monitor was no longer doing the additional outputs.
Bob Dorr - Principal Software Engineer SQL Server
