Understanding the call tree
The profiling tools for CPU Usage and Instrumentation in Visual Studio include a call tree view that provides a visualization of the call paths in your application, along with performance data.
Sometimes, the call paths that appear in the Call Tree view may look different than you expect. To interpret the data you see in the call tree, it helps to understand the common reasons for these differences when they occur.
Here are the most common reasons:
Release build optimizations. Release builds perform many optimizations such as inline function calls. Inline functions don't appear in the call tree. In some cases, release build optimizations may also generate unexpected code that appears in the call tree.
Asynchronous functions. Asynchronous functions execute on their own thread independent of the call path, and they normally appear in a separate node.
For Instrumentation, you can configure options to view .NET async calls in a more intuitive way, within the call path where the async call was made.
Sampling of fast functions. For sampling (CPU Usage only), functions that execute very quickly may not get sampled, in which case these functions don't appear in the call tree.
Compiler generated code. Some operations generate code that isn’t intuitive. For example, async/await patterns generate state machines. Other examples include getters/setters, pattern matching, event handlers, query syntax for LINQ, source generators (for example, creation of source generators for json serialization), and other code features. In these scenarios, some generated code may appear in the call tree.
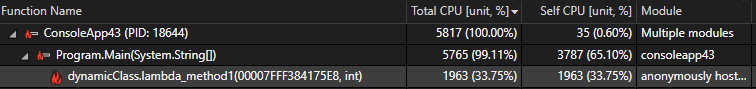
Dynamically generated code. Unlike compiler-generated code, dynamically generated code is compiled on the fly. This isn't as common as compiler-generated code. The following code uses an expression tree and results in dynamically generated code.
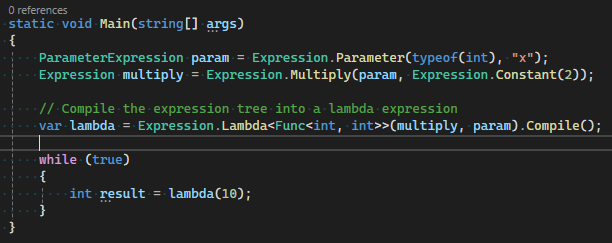
The Call Tree view shows that this work is happening in a generated method with a generated name, which might be unexpected.
Code that defers execution. For code that defers execution, such as LINQ, the call path can appear in unexpected ways if you're unfamiliar with how LINQ works. For example, if you use the following code:
// LINQ query to get all items less than 1,000,000
var query = list.Where(number => number < 1_000_000);
var count = query.Count();
You may expect the call tree to show too much time spent in the
Wherestatement, but the enumeration actually happens inCount, soCountmay show up as a slower function in the call tree. The following example is the opposite:// LINQ query to get all items less than 1,000,000 var query = list.Where(number => number < 1_000_000).ToList(); var count = query.Count();In this example,
ToListforces the enumeration beforeCount, so theCountcall is optimized and runs very fast. Instead, theWherestatement takes the most time.
