Profiling Xamarin.iOS Applications with Instruments
Xcode Instruments is a tool that can be used to profile Xamarin.iOS apps on a device or in the simulator. Mono uses its Just-in-Time model to compile code and Instruments doesn’t interpret this kind of data well, so it can be difficult to work with output from simulator-based applications that use Instruments. Because of this issue, this guide will concentrate on how to use the developer app to interpret Instruments output in this document.
Requirements
Xcode Instruments only runs on a Mac.
Opening the Instruments App
Select the device and run the Instruments app:
- Open the Xamarin.iOS project in Visual Studio for Mac.
- Select the Debug|iPhone configuration.
- Connect an iOS device to the computer.
- In the Run menu, select Upload to Device . The application will now be built and uploaded to the device.
- In the Tools menu, select Launch Instruments.
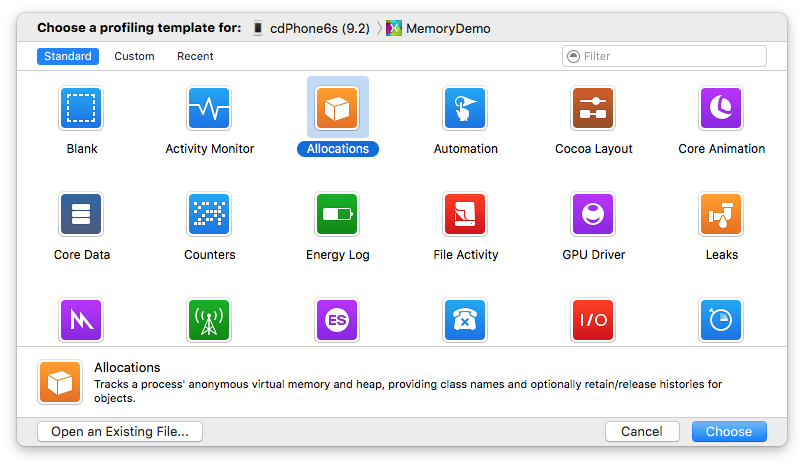
Instruments will now open and display the following dialog:
Click to select the Allocations template. The other templates are valid, however this article only discusses the Allocations profile template.
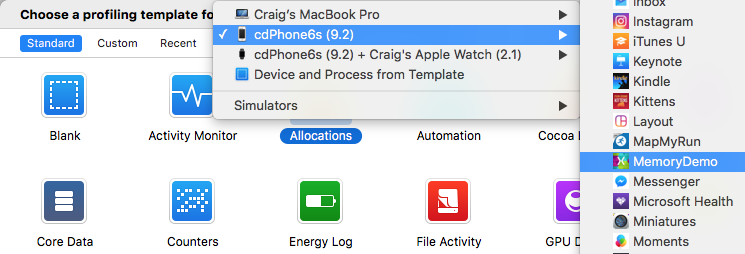
Next, select the device and application using the menu at the top of the window:
The iOS device should selected in the menu at the top of the window and the application to be profiled should be selected next to it (MemoryDemo in the screenshot above).
If the device is not listed under in the menu, check the Console in Visual Studio for Mac for error messages that might be displayed when the app is deployed to the device. Also, ensure that the device has been provisioned for development through the Xcode Organizer.
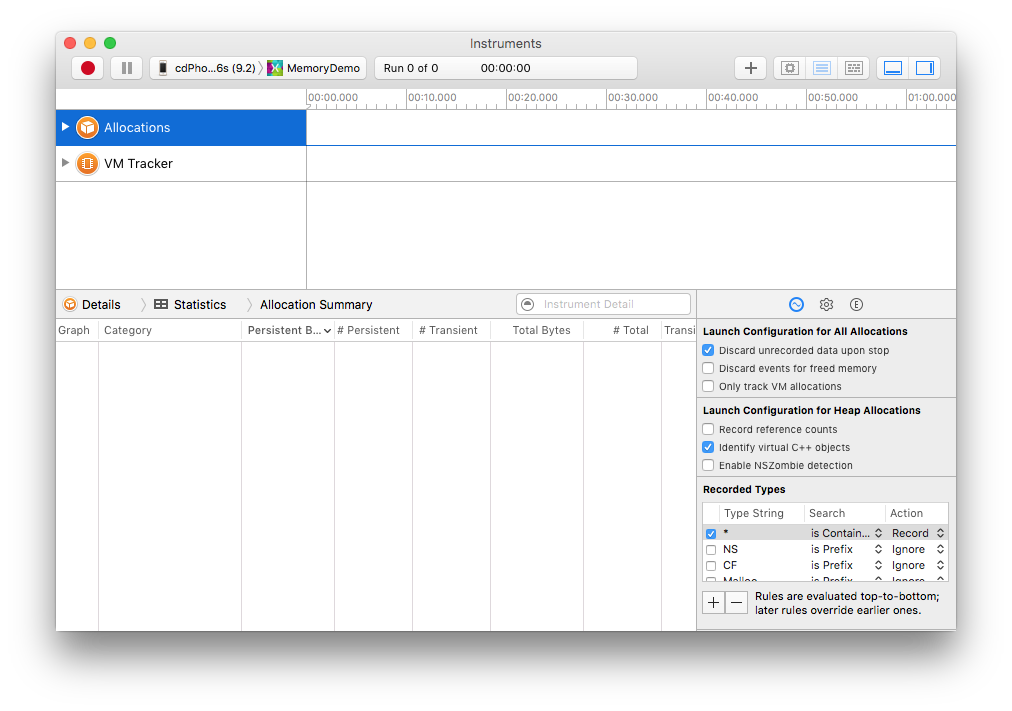
Click Choose button and the next screen should appear:
Click the record button (red circle at the top-left) to start profiling.
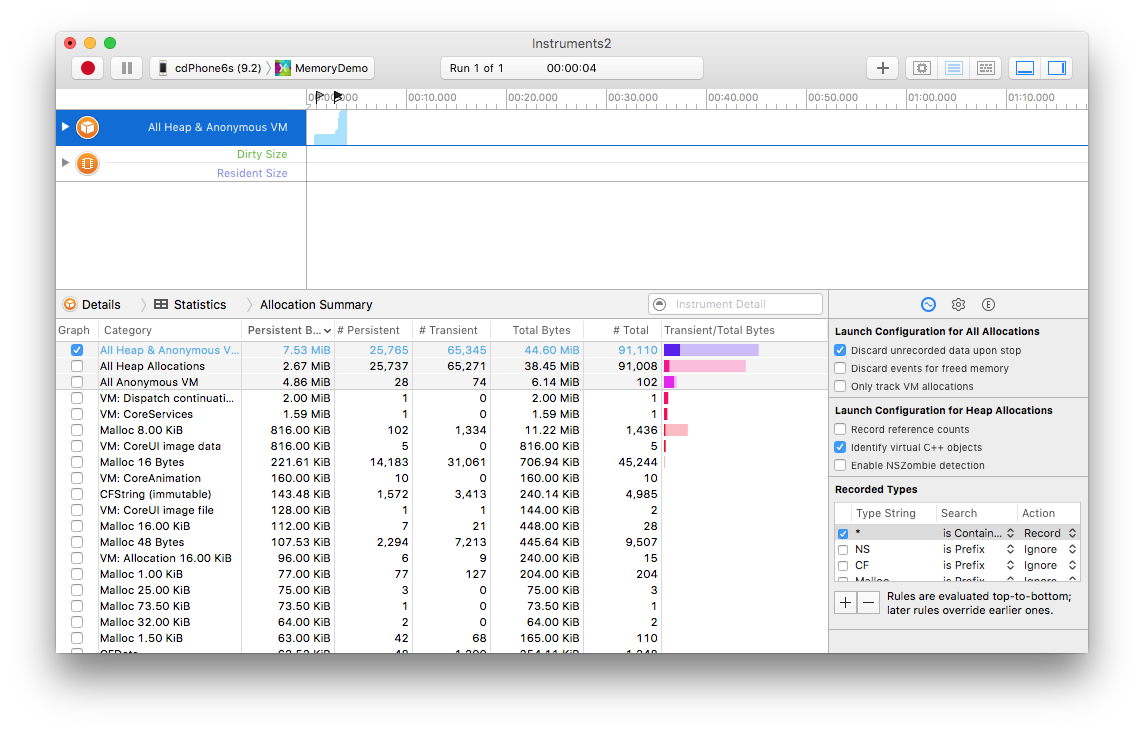
The following screenshot shows an example of profiling using Instruments:
Summary
This guide showed how to start Xcode Instruments to monitor an iOS app from within Visual Studio for Mac. Proceed to the Instruments Walkthrough for an example of how to diagnose a memory issue using Instruments.


