Overview of Azure Communication Services call logs
Azure Communication Services provides logging capabilities that you can use to monitor and debug your Communication Services solution. Configure these capabilities through the Azure portal.
The content in this article refers to logs enabled through Azure Monitor (see also FAQ). To enable these logs for Communication Services, see Enable logging in diagnostic settings.
Important
You must collect logs if you want to analyze them. To learn more, see: How do I store logs?
Azure doesn't store your call log data unless you enable these specific Diagnostic Settings. Your call data isn't retroactively available. You accumulate data once you create the Diagnostic Settings.
How to use call logs
We recommend you collect all available call logs in a log analytics resource so you can monitor your call usage and improve your call quality and receive new logs from Azure Communication Services as we release them.
There are two main tools you can use to monitor your calls and improve call quality.
We recommend using the voice and video insights dashboard dashboards to start any quality investigations, and using call diagnostics as needed to explore individual calls when you need granular detail.
Available logs
Azure Communication Services creates eight call logs:
Call summary updates logs:
These log data arrive in Azure Monitor faster than the call summary logs and we recommend using these logs instead of the call summary log schema. This log contains basic information about the call, including all the relevant IDs, time stamps, endpoints, and SDK information.
To learn more, see: Call summary log schema
Call summary logs:
This log is a subset of the Call summary updates log schema. It contains basic information about the call, including all the relevant IDs, time stamps, endpoints, and SDK information. For faster log latency, use the call summary updates logs instead.
To learn more, see: Call summary log schema
Call diagnostics updates logs:
These log data arrive in Azure Monitor faster than the call diagnostics logs and we recommend using these logs instead of the call diagnostics log schema. This log contains information about a participant's call media stream, along with a set of metrics that indicate quality of experience measurements.
To learn more, see: Call diagnostics log schema
Call diagnostics logs:
This log is a subset of the call diagnostics updates log schema. It contains information about the stream, along with a set of metrics that indicate quality of experience measurements. For faster log latency, use the call summary updates logs instead.
To learn more, see: Call diagnostics log schema
Call client operations logs:
Contain detailed call client events. These log events are generated for each EndpointId in a call and the number of event logs generated depends on the operations the participant performed during the call.
To learn more, see: Call client operations log schema
Call client media statistics logs:
Contain detailed media stream values. These logs are generated for each media stream in a call. For each EndpointId within a call (including the server), Azure Communication Services creates a distinct log for each media stream (audio or video, for example) between endpoints. The volume of data generated in each log depends on the duration of call and number of media steams in the call.
In a P2P call, each log contains data that relates to each of the outbound streams associated with each endpoint. In a group call, each stream associated with endpointType = "Server" creates a log that contains data for the inbound streams. All other streams create logs that contain data for the outbound streams for all nonserver endpoints. In group calls, use the participantId value as the key to join the related inbound and outbound logs into a distinct participant connection.
To learn more, see: Call client media statistics time series log schema
End of call survey logs:
These logs are populated when the web calling client submits a survey at the end of the call. You can use these logs to learn the subjective perception of your call quality from your users.
To learn more, see: End of call survey overview
Call metric logs:
These logs contain aggregated calling metrics in daily bins based on attributes such as SDK Version, OS name, and Error Subcode. These logs are used in the voice and video insights dashboard to visualize long term graphs of reliability, quality, and performance based on count of succeeded and failed Calling SDK api calls of various operations.
To learn more, see: Call metrics log schema
Data concepts
The following high-level descriptions of data concepts are specific to voice and video calling. These concepts are important to review so that you can understand the meaning of the data captured in the logs.
Entities and IDs
Become familiar with the following terms:
Call: As represented in the data, a call is an abstraction depicted by
correlationId. Values forcorrelationIdare unique for each call, and are time-bound based oncallStartTimeandcallDuration.Participant: Represents the connection between an endpoint and the server. A participant (
participantId) is present only when the call is a group call.Endpoint: The most unique entity, represented by
endpointId. Every call is an event that contains data from two or more endpoints. Endpoints represent the participants in the call.EndpointTypetells you whether the endpoint is a human user (PSTN or VoIP), a bot, or the server that's managing multiple participants within a call. When anendpointTypevalue is"Server", the endpoint isn't assigned a unique ID. You can analyzeendpointTypeand the number ofendpointIdvalues to determine how many users and other nonhuman participants (bots and servers) join a call.Native SDKs for Android and iOS reuse the same
endpointIdvalue for a user across multiple calls, so you can get an understanding of experiences across sessions. This process differs from web-based endpoints, which always generate a newendpointIdvalue for each new call.Stream: The most granular entity. There's one stream for each direction (inbound or outbound) and
mediaTypevalue (for example,AudioorVideo).
P2P vs. group calls
Note
In this article, P2P and group calls are within the same tenant by default. All call scenarios that are cross-tenant are specified accordingly throughout the article.
There are two types of calls, as represented by callType:
Peer to Peer (P2P) call: A connection between only two endpoints, with no server endpoint. P2P calls are initiated as a call between those endpoints and aren't created as a group call event before the connection.
Group call: Any call that has more than two endpoints connected. Group calls include a server endpoint and the connection between each endpoint and the server. P2P calls that add another endpoint during the call cease to be P2P, and they become a group call. You can determine the timeline of when each endpoint joined the call by using the
participantStartTimeandparticipantDurationmetrics.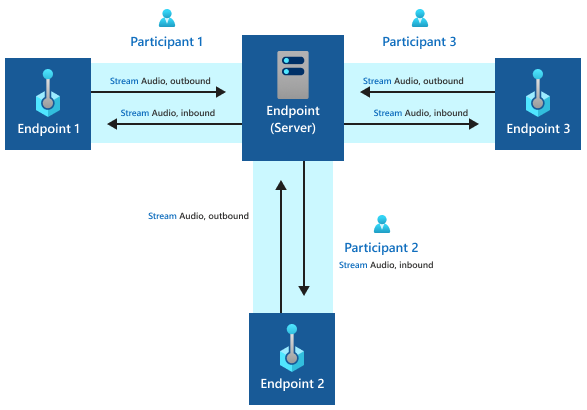
Examples of various call types
Note
In this article, P2P and group calls are within the same tenant by default. All call scenarios that are cross-tenant are specified accordingly throughout the article.
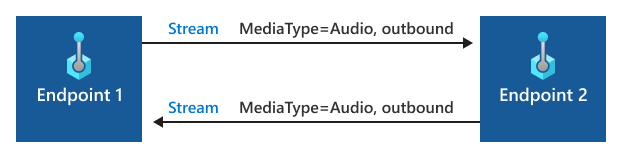
Example: P2P call
The following diagram represents two endpoints connected directly in a P2P call. In this example, Communication Services creates two call summary logs (one for each participantID value) and four call diagnostics logs (one for each media stream).
For Azure Communication Services call client participants, there are also a series of call client operations logs and call client media statistics time series logs. The exact number of these logs depend on what kind of SDK operations are called and call duration.
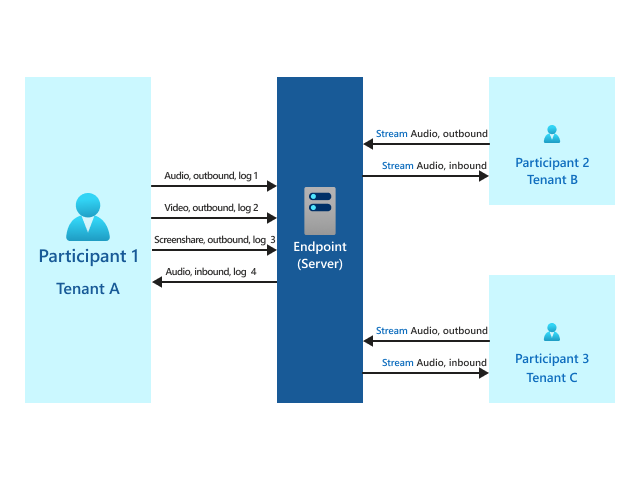
Example: Group call
The following diagram represents a group call example with three participantId values (which means three participants) and a server endpoint. Multiple values for endpointId can potentially appear in multiple participants--for example, when they rejoin a call from the same device. Communication Services creates one call summary log for each participantId value. It creates four call diagnostics logs: one for each media stream per participantId.
For Azure Communication Services call client participants, the call client operations logs are the same as P2P calls. For each participant using calling SDK, there are a series of call client operations logs.
For Azure Communication Services call client participants, the call client operations logs and call client media statistics time series logs are the same as P2P calls. For each participant using calling SDK, there are a series of call client operations logs and call client media statistics time series logs.

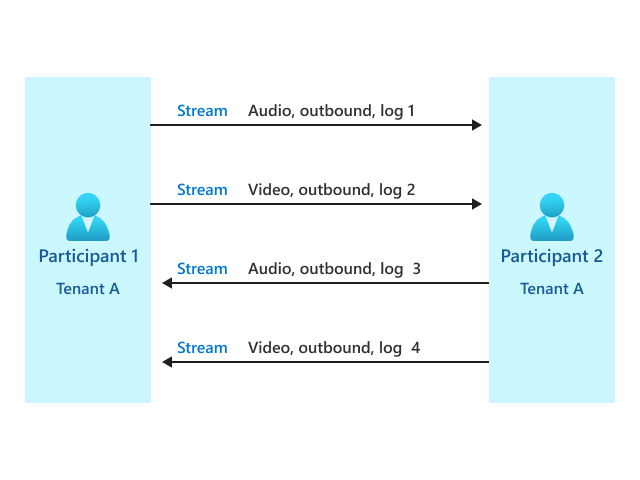
Example: Cross-tenant P2P call
The following diagram represents two participants across multiple tenants that are connected directly in a P2P call. In this example, Communication Services creates one call summary log (one for each participant) with redacted OS and SDK versions. Communication Services also creates four call diagnostics logs (one for each media stream). Each log contains data that relates to the outbound stream of participantID.
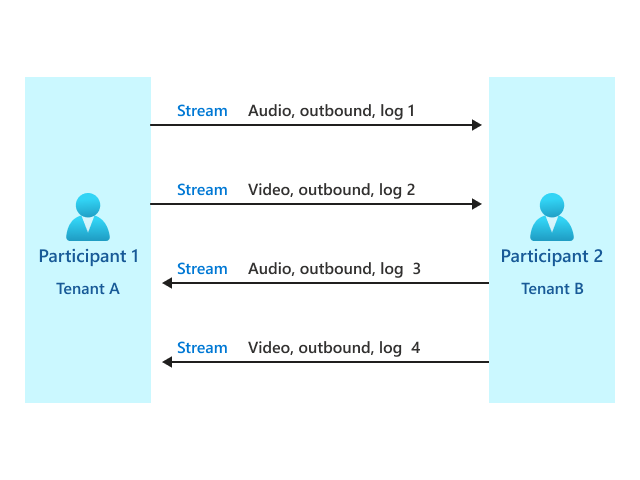
Example: Cross-tenant group call
The following diagram represents a group call example with three participantId values across multiple tenants. Communication Services creates one call summary log for each participant with redacted OS and SDK versions. Communication Services also creates four call diagnostics logs that relate to each participantId value (one for each media stream).
Note
This release supports only outbound diagnostics logs. OS and SDK versions associated with the bot and the participant can be redacted because Communication Services treats identities of participants and bots the same way.
Frequently asked questions
How do I store logs?
The following section explains this requirement.
Azure Communication Services logs aren't stored in your Azure account by default so you need to begin storing them in order for tools like voice and video insights dashboard and call diagnostics to work. To collect these call logs, you need to enable a diagnostic setting that directs the call data to a Log Analytics workspace.
Data isn’t stored retroactively, so you begin capturing call logs only after configuring the diagnostic setting.
Follow instructions to add diagnostic settings for your resource in Enable logs via Diagnostic Settings in Azure Monitor. We recommend that you initially collect all logs. After you understand the capabilities in Azure Monitor, determine which logs you want to retain and for how long. When you add your diagnostic setting, you're prompted to select logs. To collect all logs, select allLogs.
Your data volume, retention, and usage in Log Analytics within Azure Monitor is billed through existing Azure data meters. We recommend that you monitor your data usage and retention policies for cost considerations as needed. For more information, see Controlling costs.
If you have multiple Azure Communications Services resource IDs, you must enable these settings for each resource ID.
Next steps
Learn best practices to manage your call quality and reliability, see: Improve and manage call quality
Learn about the insights dashboard to monitor Voice Calling and Video Calling logs.
Learn how to use call logs to diagnose call quality and reliability issues with Call Diagnostics, see: Call Diagnostics