Transaction search is a feature of Application Insights that you use to find and explore individual telemetry items, such as page views, exceptions, or web requests. You can also view log traces and events that you code.
For more complex queries over your data, use Log Analytics.
Where do you see Search?
You can find Search in the Azure portal or Visual Studio.
In the Azure portal
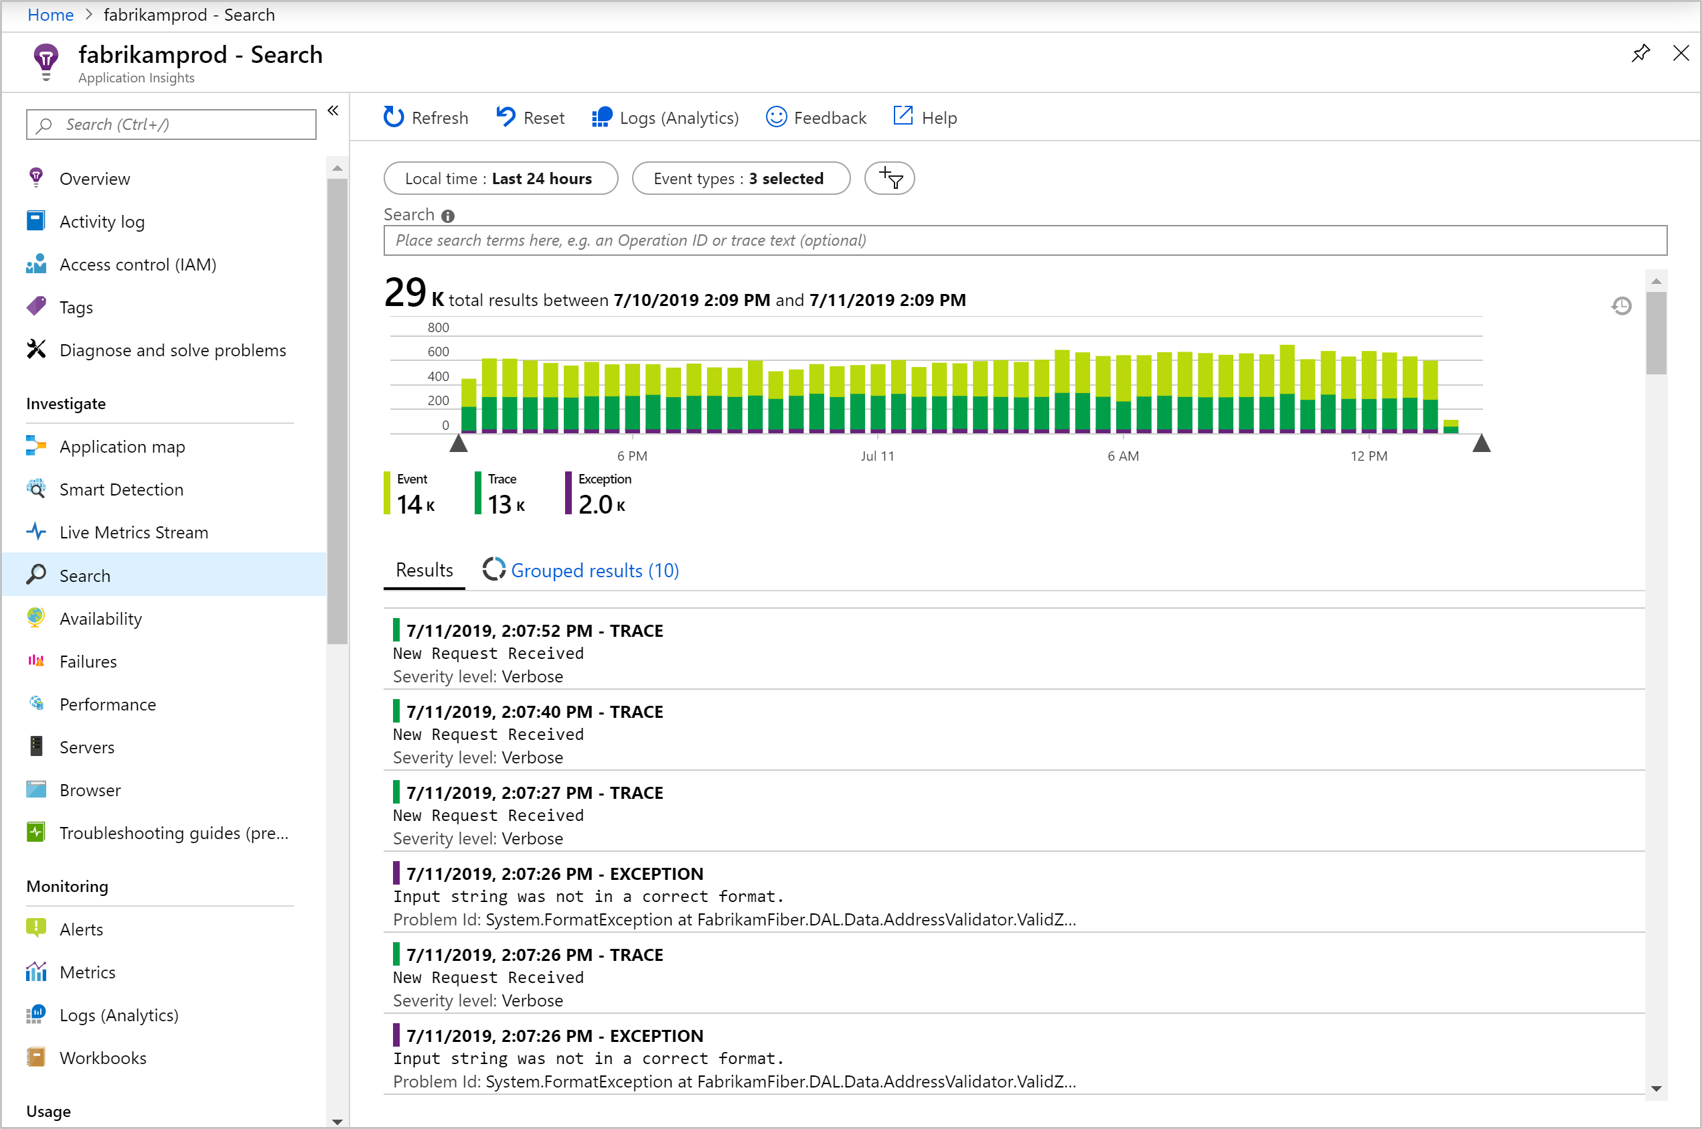
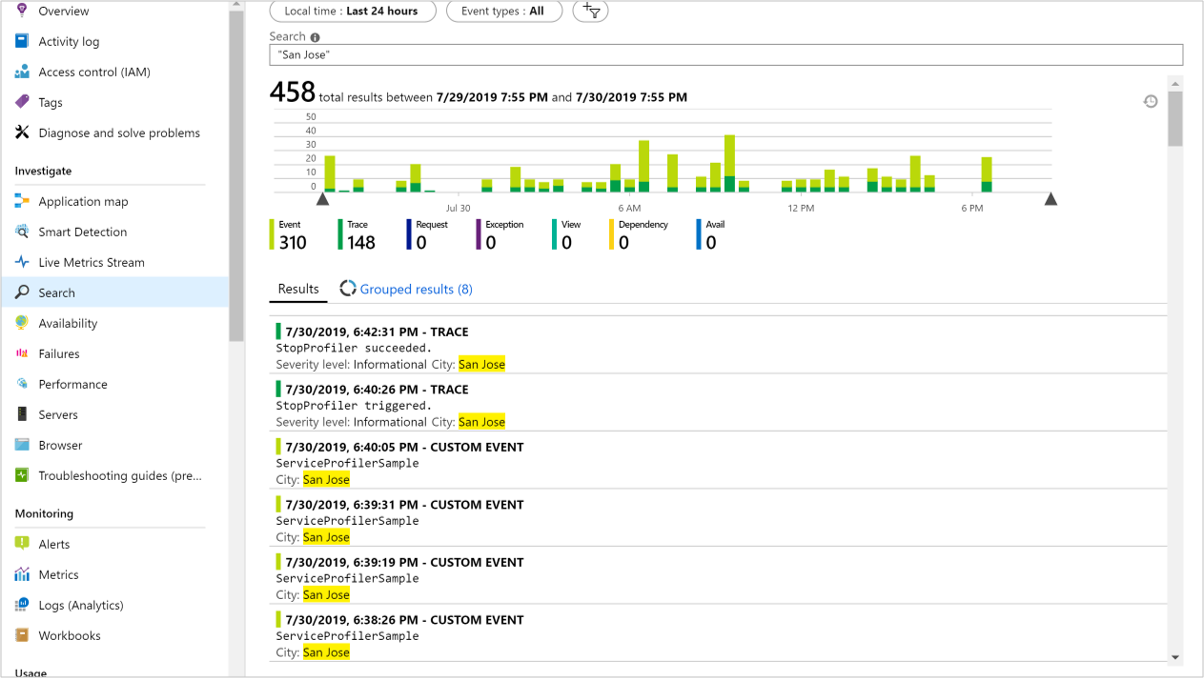
You can open transaction search from the Application Insights Overview tab of your application. You can also select Search under Investigate on the left menu.

Go to the Event types dropdown menu to see a list of telemetry items such as server requests, page views, and custom events you coded. The top of the Results list has a summary chart showing counts of events over time.
Back out of the dropdown menu or select Refresh to get new events.
In Visual Studio
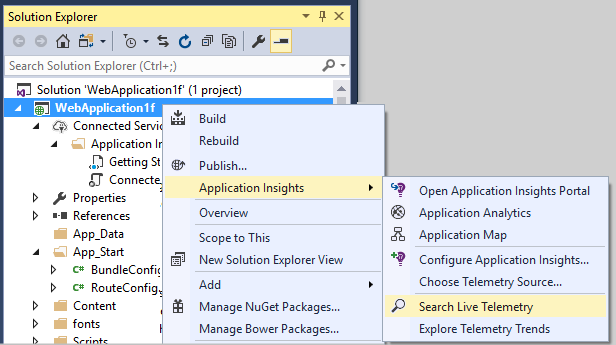
In Visual Studio, there's also an Application Insights Search window. It's most useful for displaying telemetry events generated by the application that you're debugging. But it can also show the events collected from your published app at the Azure portal.
Open the Application Insights Search window in Visual Studio:

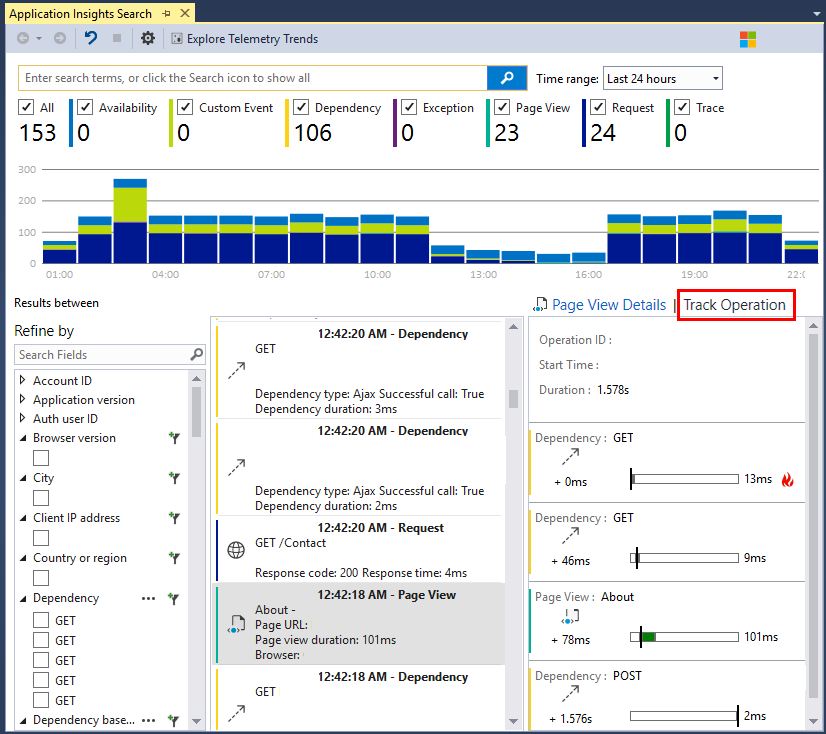
The Application Insights Search window has features similar to the web portal:

The Track Operation tab is available when you open a request or a page view. An "operation" is a sequence of events associated with a single request or page view. For example, dependency calls, exceptions, trace logs, and custom events might be part of a single operation. The Track Operation tab shows graphically the timing and duration of these events in relation to the request or page view.
Inspect individual items
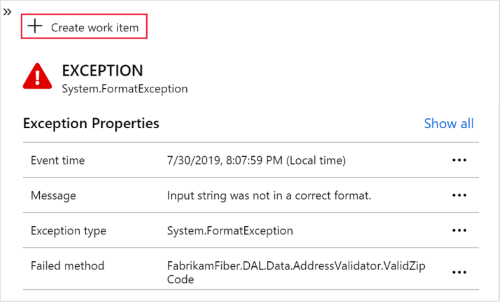
Select any telemetry item to see key fields and related items.

The end-to-end transaction details view opens.
Filter event types
Open the Event types dropdown menu and choose the event types you want to see. If you want to restore the filters later, select Reset.
The event types are:
- Trace: Diagnostic logs including TrackTrace, log4Net, NLog, and System.Diagnostic.Trace calls.
- Request: HTTP requests received by your server application including pages, scripts, images, style files, and data. These events are used to create the request and response overview charts.
- Page View: Telemetry sent by the web client used to create page view reports.
- Custom Event: If you inserted calls to
TrackEvent() to monitor usage, you can search them here.
- Exception: Uncaught exceptions in the server, and the exceptions that you log by using
TrackException().
- Dependency: Calls from your server application to other services such as REST APIs or databases, and AJAX calls from your client code.
- Availability: Results of availability tests
Filter on property values
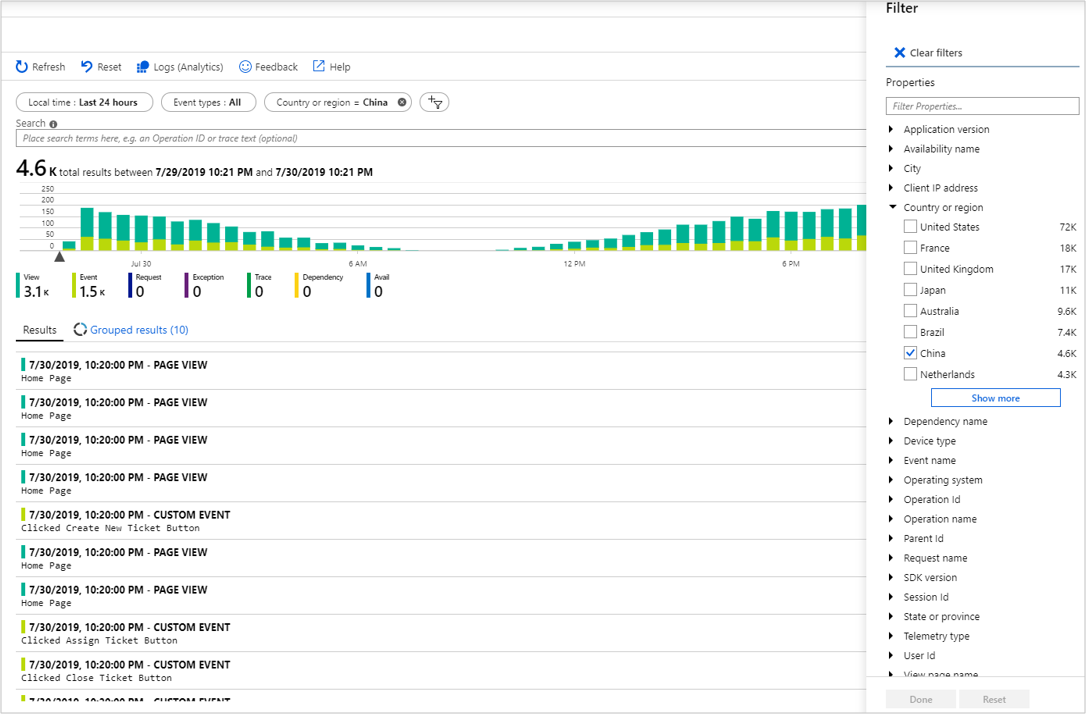
You can filter events on the values of their properties. The available properties depend on the event types you selected. Select Filter
 to start.
Choosing no values of a particular property has the same effect as choosing all values. It switches off filtering on that property.
Notice that the counts to the right of the filter values show how many occurrences there are in the current filtered set.
Find events with the same property
To find all the items with the same property value, either enter it in the Search box or select the checkbox when you look through properties on the Filter tab.

Search the data
Note
To write more complex queries, open Logs (Analytics) at the top of the Search pane.
You can search for terms in any of the property values. This capability is useful if you write custom events with property values.
You might want to set a time range because searches over a shorter range are faster.

Search for complete words, not substrings. Use quotation marks to enclose special characters.
| String |
Not found |
Found |
| HomeController.About |
home
controller
out |
homecontroller
about
"homecontroller.about" |
| United States |
Uni
ted |
united
states
united AND states
"united states" |
You can use the following search expressions:
| Sample query |
Effect |
apple |
Find all events in the time range whose fields include the word apple. |
apple AND banana
apple banana |
Find events that contain both words. Use capital AND, not and.
Short form. |
apple OR banana |
Find events that contain either word. Use OR, not or. |
apple NOT banana |
Find events that contain one word but not the other. |
Sampling
If your app generates significant telemetry and uses ASP.NET SDK version 2.0.0-beta3 or later, it automatically reduces the volume sent to the portal through adaptive sampling. This module sends only a representative fraction of events. It selects or deselects events related to the same request as a group, allowing you to navigate between related events.
Learn about sampling.
Create work item
You can create a bug in GitHub or Azure DevOps with the details from any telemetry item.
Go to the end-to-end transaction detail view by selecting any telemetry item. Then select Create work item.

The first time you do this step, you're asked to configure a link to your Azure DevOps organization and project. You can also configure the link on the Work Items tab.
Send more telemetry to Application Insights
In addition to the out-of-the-box telemetry sent by Application Insights SDK, you can:
Capture log traces from your favorite logging framework in .NET or Java. This means you can search through your log traces and correlate them with page views, exceptions, and other events.
Write code to send custom events, page views, and exceptions.
Learn how to send logs and custom telemetry to Application Insights.
Frequently asked questions
Find answers to common questions.
How much data is retained?
See the Limits summary.
How can I see POST data in my server requests?
We don't log the POST data automatically, but you can use TrackTrace or log calls. Put the POST data in the message parameter. You can't filter on the message in the same way you can filter on properties, but the size limit is longer.
Why does my Azure Function search return no results?
Azure Functions doesn't log URL query strings.
The unified diagnostics experience automatically correlates server-side telemetry from across all your Application Insights monitored components into a single view. It doesn't matter if you have multiple resources. Application Insights detects the underlying relationship and allows you to easily diagnose the application component, dependency, or exception that caused a transaction slowdown or failure.
What is a component?
Components are independently deployable parts of your distributed or microservice application. Developers and operations teams have code-level visibility or access to telemetry generated by these application components.
- Components are different from "observed" external dependencies, such as SQL and event hubs, which your team or organization might not have access to (code or telemetry).
- Components run on any number of server, role, or container instances.
- Components can be separate Application Insights instrumentation keys, even if subscriptions are different. Components also can be different roles that report to a single Application Insights instrumentation key. The new experience shows details across all components, regardless of how they were set up.
Note
Are you missing the related item links? All the related telemetry is on the left side in the top and bottom sections.
Transaction diagnostics experience
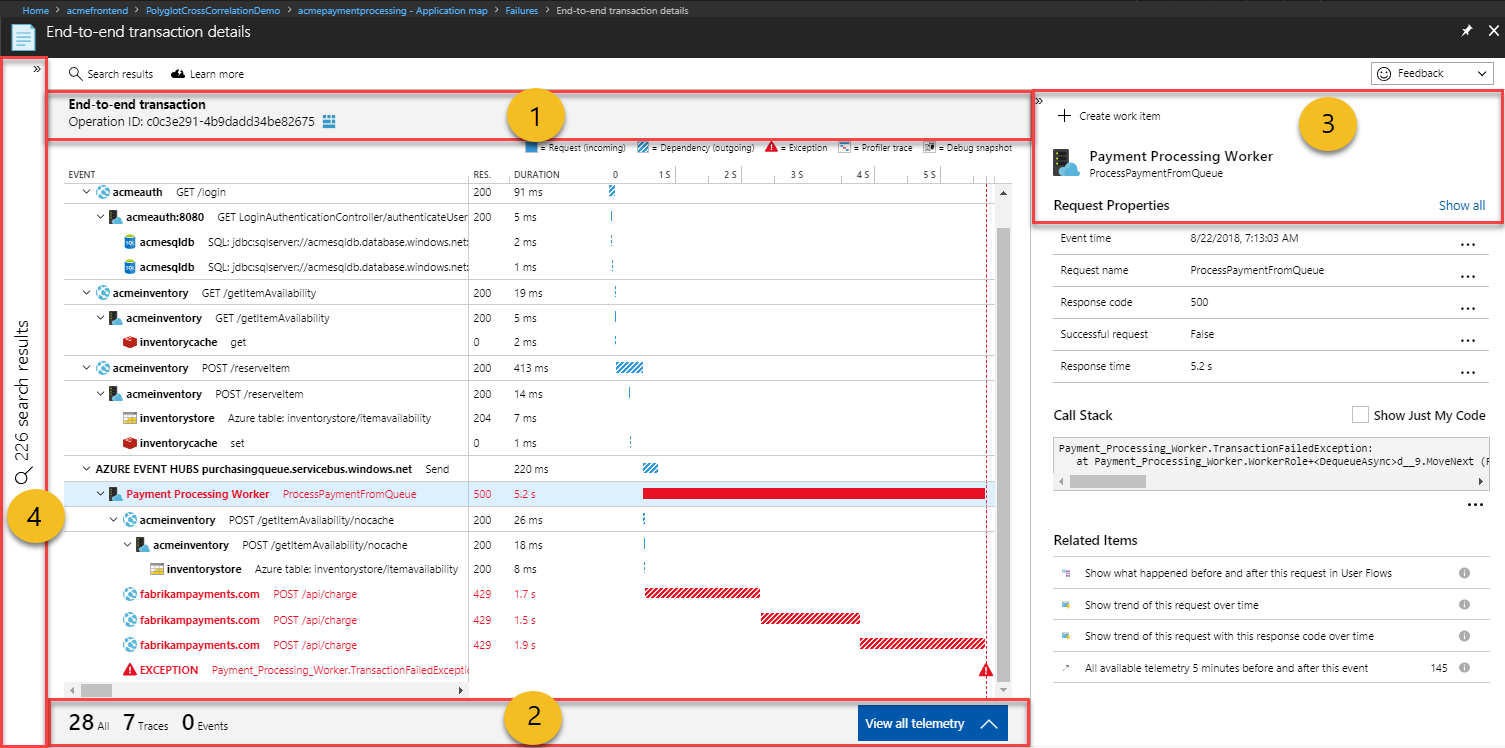
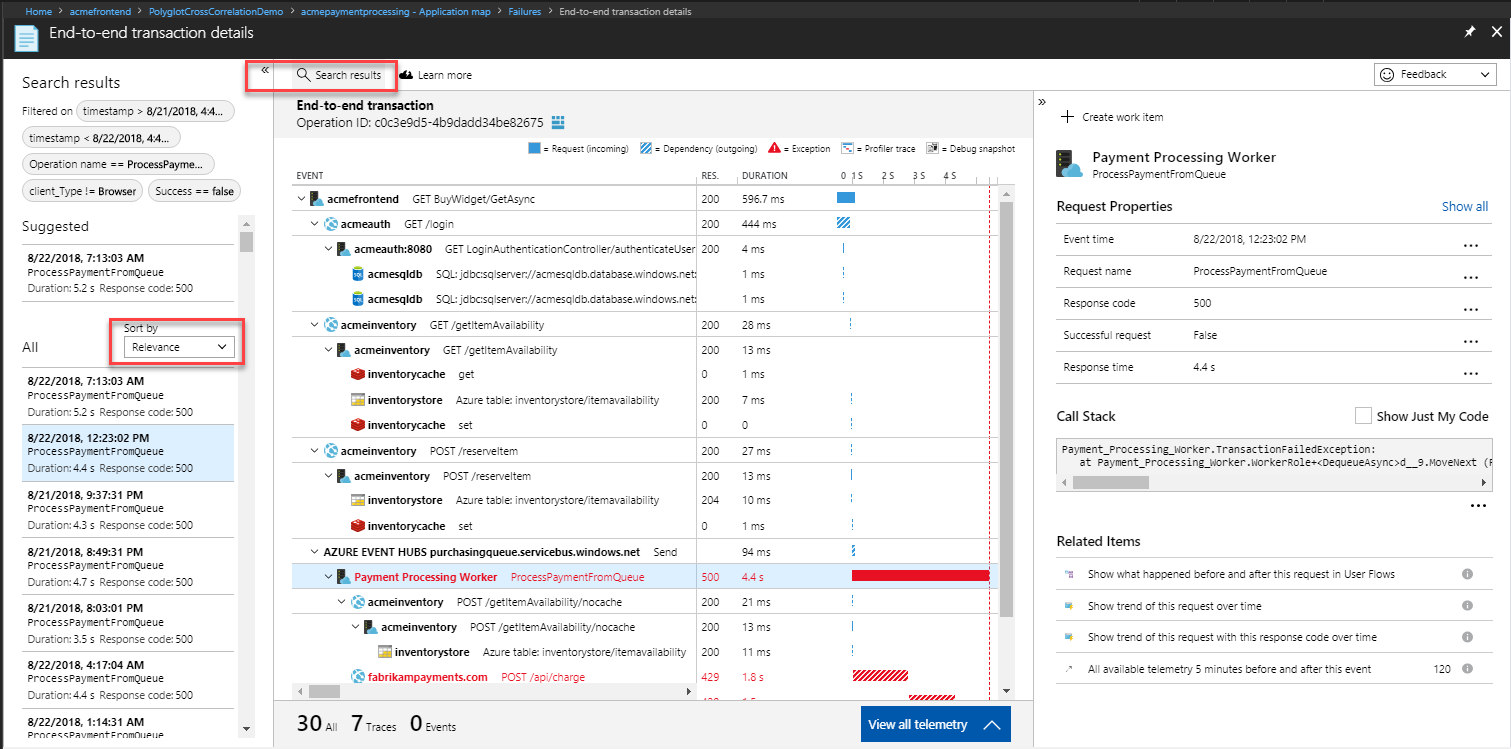
This view has four key parts:
- a results list
- a cross-component transaction chart
- a time-sequence list of all telemetry related to this operation
- the details pane for any selected telemetry item

Cross-component transaction chart
This chart provides a timeline with horizontal bars during requests and dependencies across components. Any exceptions that are collected are also marked on the timeline.
- The top row on this chart represents the entry point. It's the incoming request to the first component called in this transaction. The duration is the total time taken for the transaction to complete.
- Any calls to external dependencies are simple noncollapsible rows, with icons that represent the dependency type.
- Calls to other components are collapsible rows. Each row corresponds to a specific operation invoked at the component.
- By default, the request, dependency, or exception that you selected appears to the side. Select any row to see its details.
Note
Calls to other components have two rows. One row represents the outbound call (dependency) from the caller component. The other row corresponds to the inbound request at the called component. The leading icon and distinct styling of the duration bars help differentiate between them.
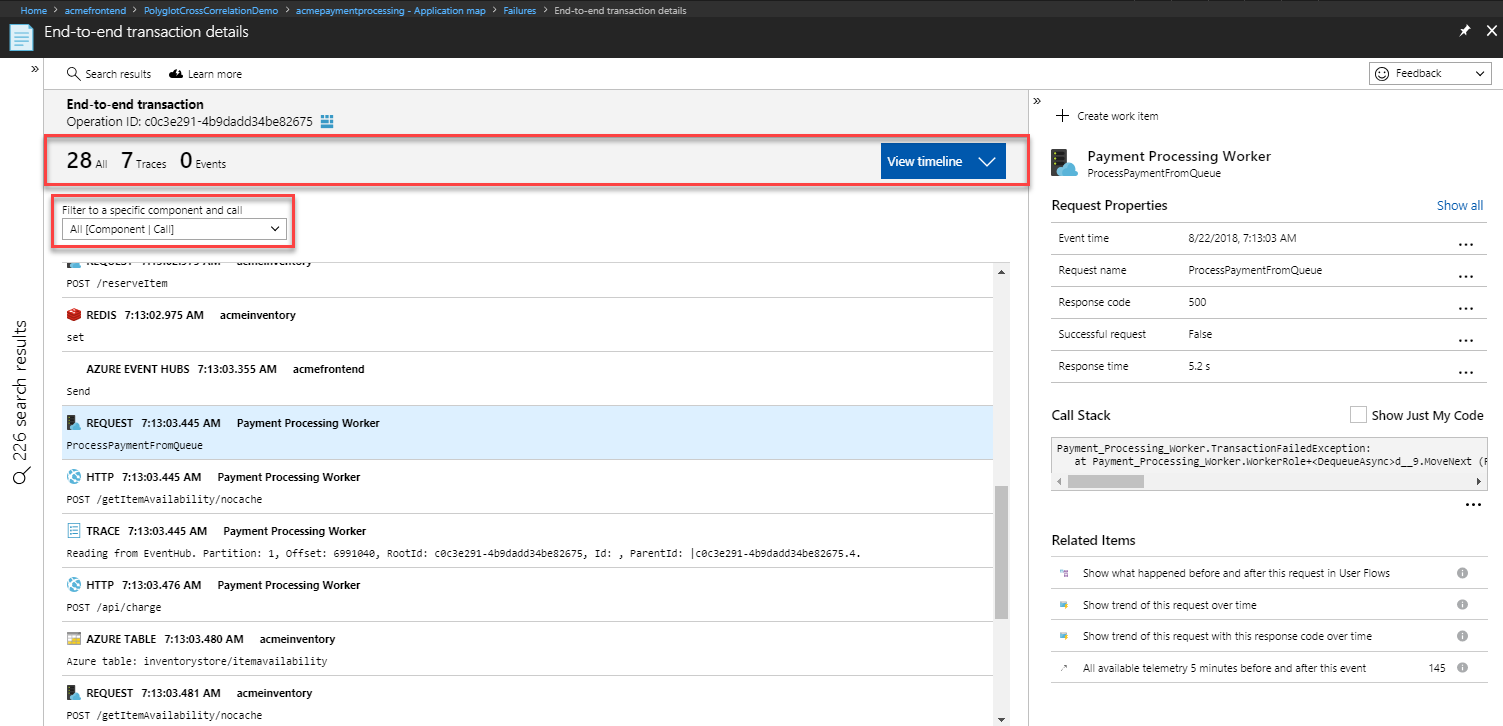
All telemetry with this Operation ID
This section shows a flat list view in a time sequence of all the telemetry related to this transaction. It also shows the custom events and traces that aren't displayed in the transaction chart. You can filter this list to telemetry generated by a specific component or call. You can select any telemetry item in this list to see corresponding details on the side.

Details of the selected telemetry
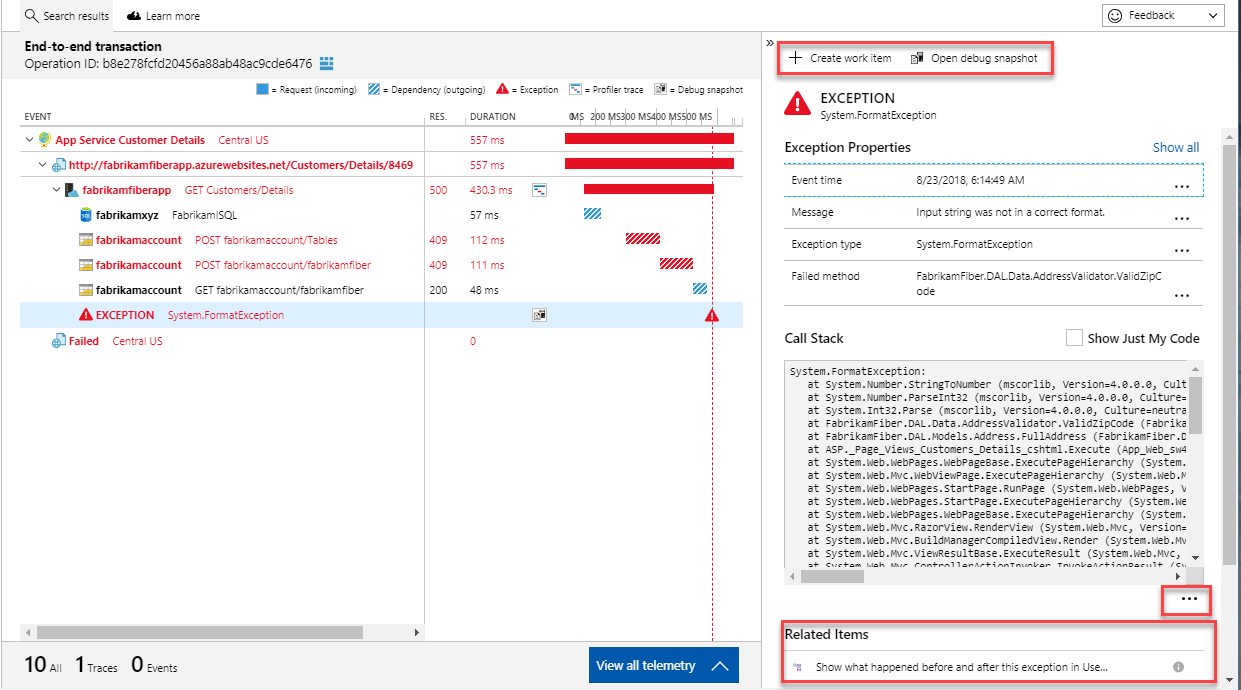
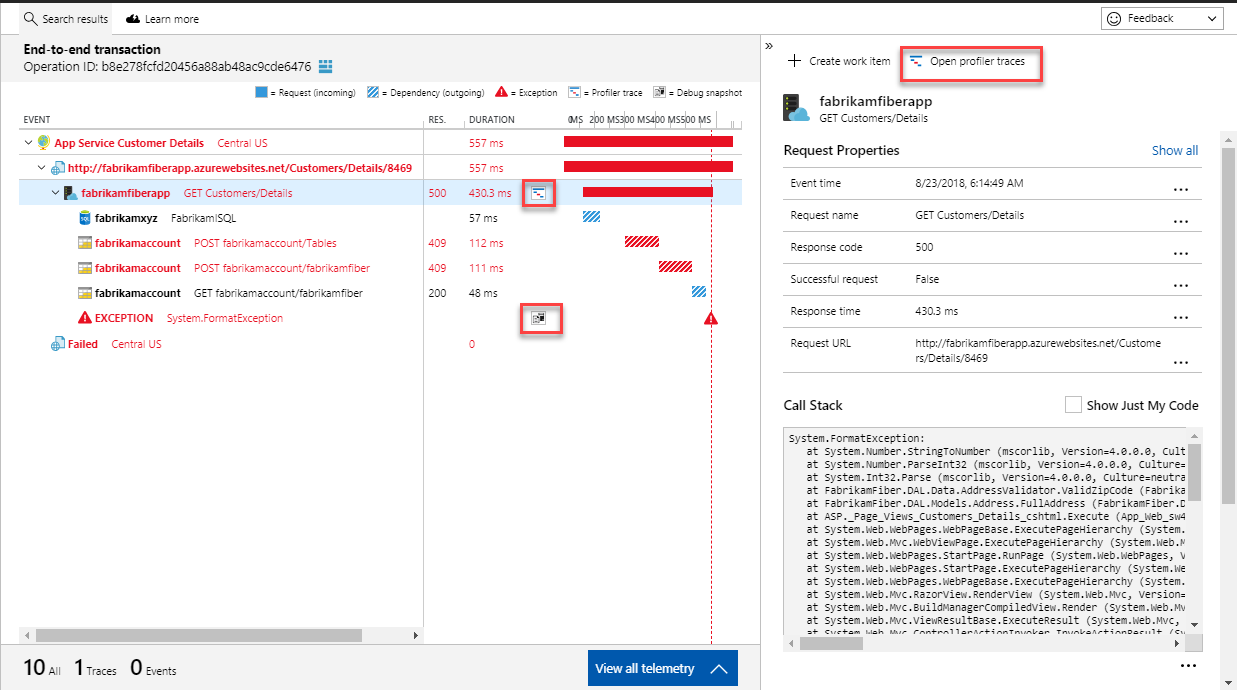
This collapsible pane shows the detail of any selected item from the transaction chart or the list. Show all lists all the standard attributes that are collected. Any custom attributes are listed separately under the standard set. Select the ellipsis button (...) under the Call Stack trace window to get an option to copy the trace. Open profiler traces and Open debug snapshot show code-level diagnostics in corresponding detail panes.

Search results
This collapsible pane shows the other results that meet the filter criteria. Select any result to update the respective details of the preceding three sections. We try to find samples that are most likely to have the details available from all components, even if sampling is in effect in any of them. These samples are shown as suggestions.

.NET Profiler and Snapshot Debugger
.NET Profiler or Snapshot Debugger help with code-level diagnostics of performance and failure issues. With this experience, you can see .NET Profiler traces or snapshots from any component with a single selection.
If you can't get the .NET Profiler working, contact serviceprofilerhelp@microsoft.com.
If you can't get Snapshot Debugger working, contact snapshothelp@microsoft.com.

Frequently asked questions
This section provides answers to common questions.
Why do I see a single component on the chart and the other components only show as external dependencies without any details?
Potential reasons:
- Are the other components instrumented with Application Insights?
- Are they using the latest stable Application Insights SDK?
- If these components are separate Application Insights resources, validate you have access.
If you do have access and the components are instrumented with the latest Application Insights SDKs, let us know via the feedback channel in the upper-right corner.
I see duplicate rows for the dependencies. Is this behavior expected?
Currently, we're showing the outbound dependency call separate from the inbound request. Typically, the two calls look identical with only the duration value being different because of the network round trip. The leading icon and distinct styling of the duration bars help differentiate between them. Is this presentation of the data confusing? Give us your feedback!
What about clock skews across different component instances?
Timelines are adjusted for clock skews in the transaction chart. You can see the exact timestamps in the details pane or by using Log Analytics.
This behavior is by design. All the related items, across all components, are already available on the left side in the top and bottom sections. The new experience has two related items that the left side doesn't cover: all telemetry from five minutes before and after this event and the user timeline.
Is there a way to see fewer events per transaction when I use the Application Insights JavaScript SDK?
The transaction diagnostics experience shows all telemetry in a single operation that shares an Operation ID. By default, the Application Insights SDK for JavaScript creates a new operation for each unique page view. In a single-page application (SPA), only one page view event is generated and a single Operation ID is used for all telemetry generated. As a result, many events might be correlated to the same operation.
In these scenarios, you can use Automatic Route Tracking to automatically create new operations for navigation in your SPA. You must turn on enableAutoRouteTracking so that a page view is generated every time the URL route is updated (logical page view occurs). If you want to manually refresh the Operation ID, call appInsights.properties.context.telemetryTrace.traceID = Microsoft.ApplicationInsights.Telemetry.Util.generateW3CId(). Manually triggering a PageView event also resets the Operation ID.
Why do transaction detail durations not add up to the top-request duration?
Time not explained in the Gantt chart is time that isn't covered by a tracked dependency. This issue can occur because external calls weren't instrumented, either automatically or manually. It can also occur because the time taken was in process rather than because of an external call.
If all calls were instrumented, in process is the likely root cause for the time spent. A useful tool for diagnosing the process is the .NET Profiler.
What if I see the message Error retrieving data while navigating Application Insights in the Azure portal?
This error indicates that the browser was unable to call into a required API or the API returned a failure response. To troubleshoot the behavior, open a browser InPrivate window and disable any browser extensions that are running, then identify if you can still reproduce the portal behavior. If the portal error still occurs, try testing with other browsers, or other machines, investigate DNS or other network related issues from the client machine where the API calls are failing. If the portal error continues and needs more investigation, collect a browser network trace while reproducing the unexpected portal behavior, then open a support case from the Azure portal.
![]() to start.
to start.