Continuously monitor your generative AI applications
Important
Items marked (preview) in this article are currently in public preview. This preview is provided without a service-level agreement, and we don't recommend it for production workloads. Certain features might not be supported or might have constrained capabilities. For more information, see Supplemental Terms of Use for Microsoft Azure Previews.
Continuous advancements in Generative AI have led organizations to build increasingly complex applications to solve various problems (chat-bots, RAG systems, agentic systems, etc.). These applications are being used to drive innovation, improve customer experiences, and enhance decision-making. Although the models (for example, GPT-4o) powering these Generative AI applications are extremely capable, continuous monitoring has never been more important to ensure high-quality, safe, and reliable results. Continuous monitoring is effective when multiple perspectives are considered when observing an application. These perspectives include token usage and cost, operational metrics – latency, request count, etc. - and, importantly, continuous evaluation. To learn more about evaluation, see Evaluation of generative AI applications.
Azure AI and Azure Monitor provide tools for you to continuously monitor the performance of your Generative AI applications from multiple perspectives. With Azure AI Online Evaluation, you can continuously evaluate your application agnostic of where it's deployed or what orchestration framework it's using (for example, LangChain). You can use various built-in evaluators which maintain parity with the Azure AI Evaluation SDK or define your own custom evaluators. By continuously running the right evaluators over your collected trace data, your team can more effectively identify and mitigate security, quality, and safety concerns as they arise, either in pre-production or post-production. Azure AI Online Evaluation provides full integration with the comprehensive suite of observability tooling available in Azure Monitor Application Insights, enabling you to build custom dashboards, visualize your evaluation results over time, and configure alerting for advanced application monitoring.
In summary, monitoring your generative AI applications has never been more important, due to the complexity and rapid evolvement of the AI industry. Azure AI Online Evaluation, integrated with Azure Monitor Application Insights, enables you to continuously evaluate your deployed applications to ensure that they're performant, safe, and produce high-quality results in production.
How to monitor your generative AI applications
In this section, learn how to monitor your generative AI applications using Azure AI Foundry tracing, online evaluation, and trace visualization functionality. Then, learn how Azure AI Foundry integrates with Azure Monitor Application Insights for comprehensive observability and visualization.
Tracing your generative AI application
The first step in continuously monitoring your application is to ensure that its telemetry data is captured and stored for analysis. To accomplish this, you'll need to instrument your generative AI application’s code to use the Azure AI Tracing package to log trace data to an Azure Monitor Application Insights resource of your choice. This package fully conforms with the OpenTelemetry standard for observability. After you have instrumented your application's code, the trace data will be logged to your Application Insights resource.
After you have included tracing in your application code, you can view the trace data in Azure AI Foundry or in your Azure Monitor Application Insights resource. To learn more about how to do this, see monitor your generative AI application.
Set up online evaluation
After setting up tracing for your generative AI application, set up online evaluation with the Azure AI Foundry SDK to continuously evaluate your trace data as it is collected. Doing so will enable you to monitor your application's performance in production over time.
Note
If you have multiple AI applications logging trace data to the same Azure Monitor Application Insights resource, it's recommended to use the service name to differentiate between application data in Application Insights. To learn how to set the service name, see Azure AI Tracing. To learn how to query for the service name within your online evaluation configuration, see using service name in trace data.
Monitor your generative AI application with Azure Monitor Application Insights
In this section, you learn how Azure AI integrates with Azure Monitor Application Insights to give you an out-of-the-box dashboard view that is tailored with insights regarding your generative AI app so you can stay updated with the latest status of your application.
Insights for your generative AI application
If you haven’t set this up, here are some quick steps:
- Navigate to your project in Azure AI Foundry.
- Select the Tracing page on the left-hand side.
- Connect your Application Insights resource to your project.
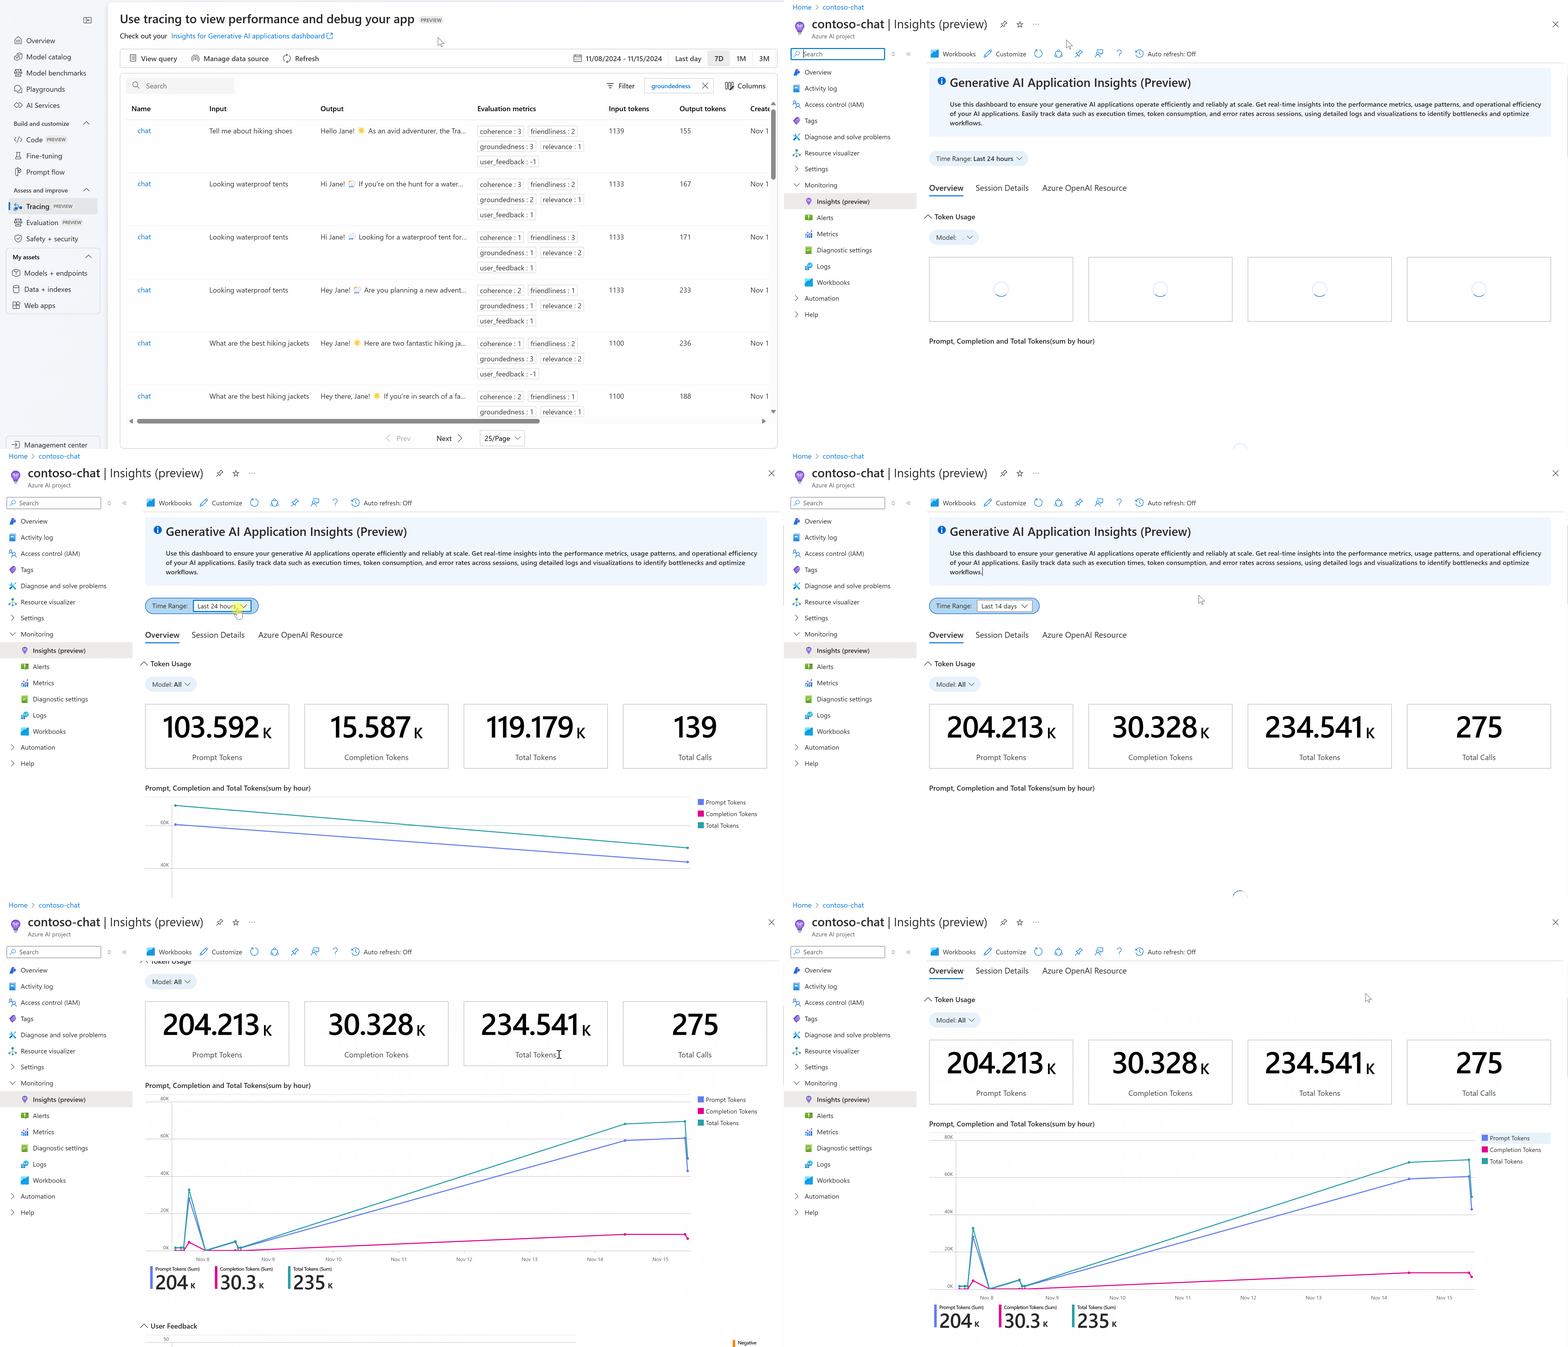
If you already set up tracing in Azure AI Foundry portal, all you need to do is select the link to Check out your Insights for Generative AI application dashboard.
Once you have your data streaming into your Application Insights resource, you automatically can see it get populated in this customized dashboard.
This view is a great place for you to get started with your monitoring needs.
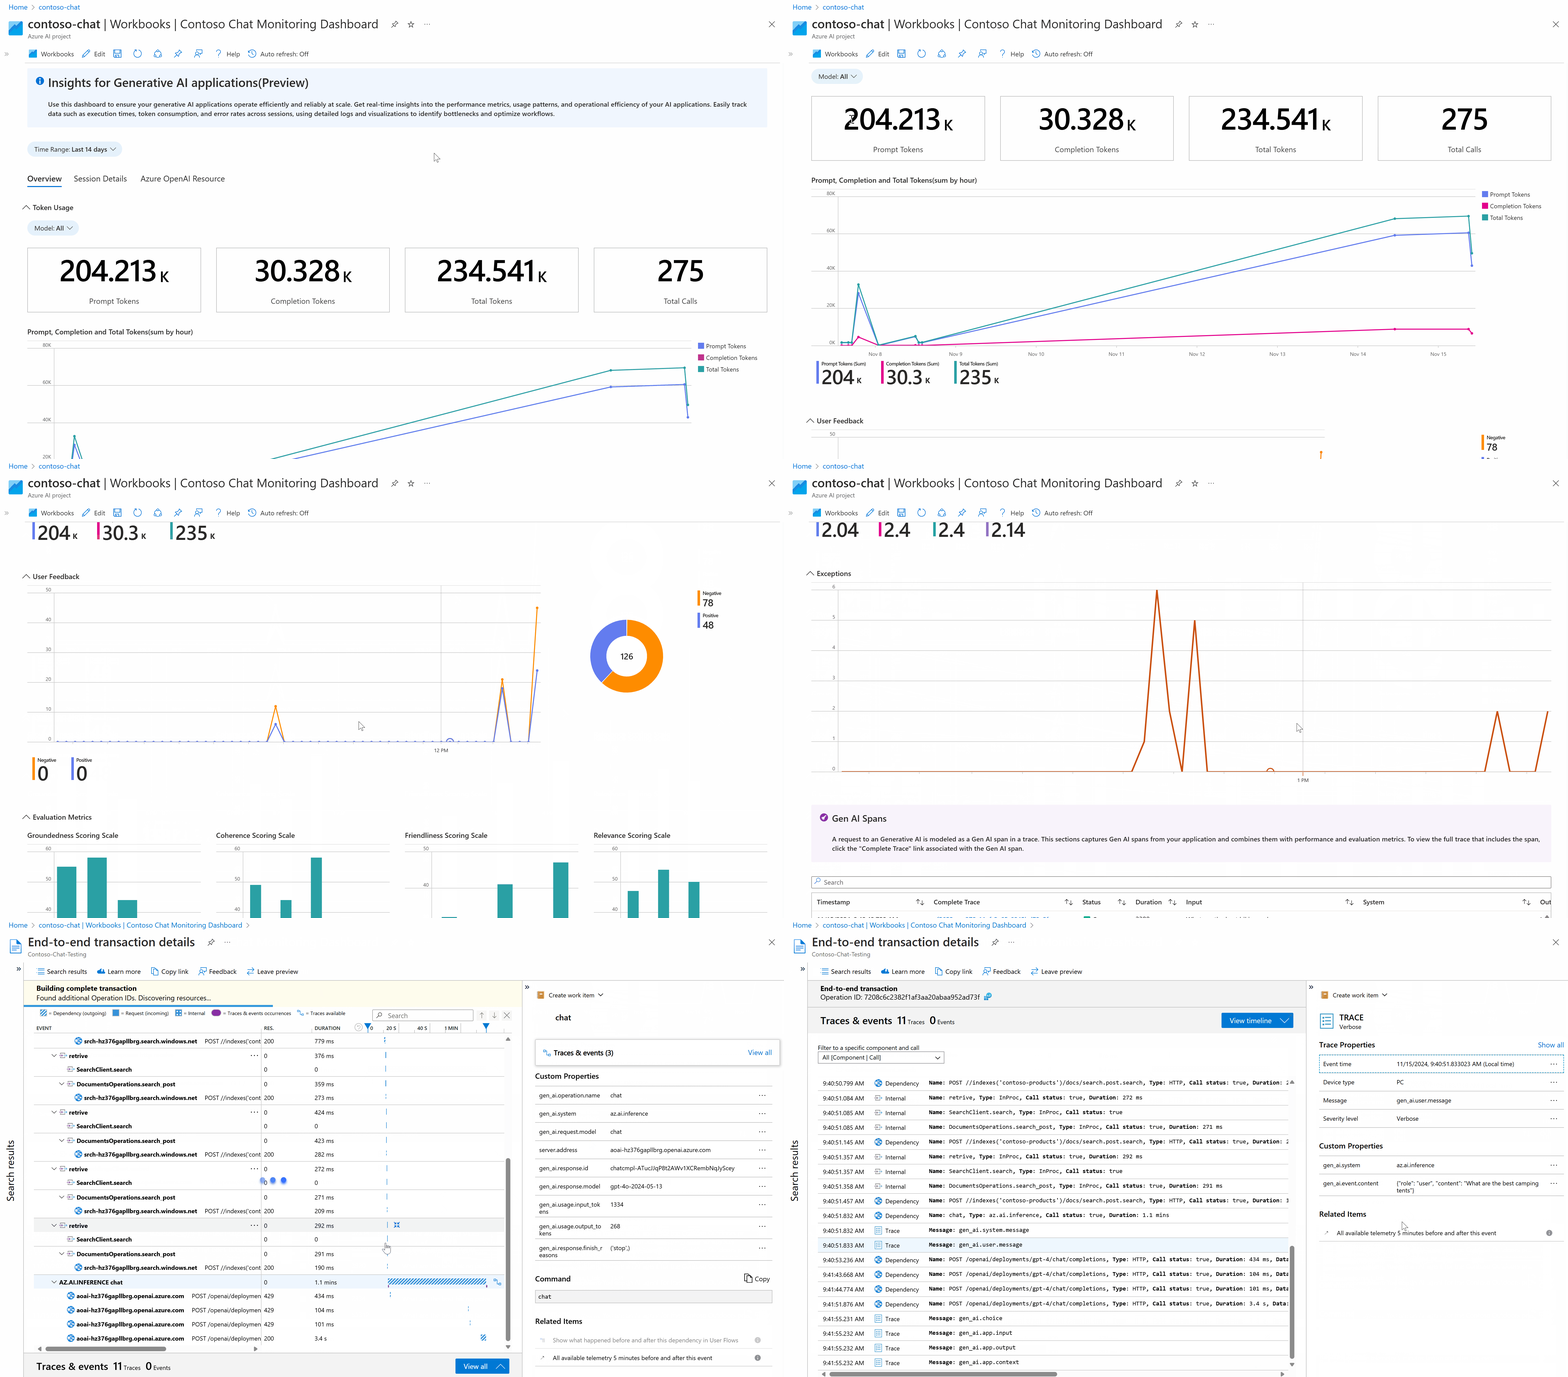
- You can view token consumption over time to understand if you need to increase your usage limits or do additional cost analysis.
- You can view evaluation metrics as trend lines to understand the quality of your app on a daily basis.
- You can debug when exceptions take place and drill into traces using the Azure Monitor End-to-end transaction details view to figure out what went wrong.
This is an Azure Workbook that is querying data stored in your Application Insights resource. You can customize this workbook and tailor this to fit your business needs. To learn more, see editing Azure Workbooks.
This allows you to add additional custom evaluators that you might have logged or other markdown text to share summaries and use for reporting purposes.
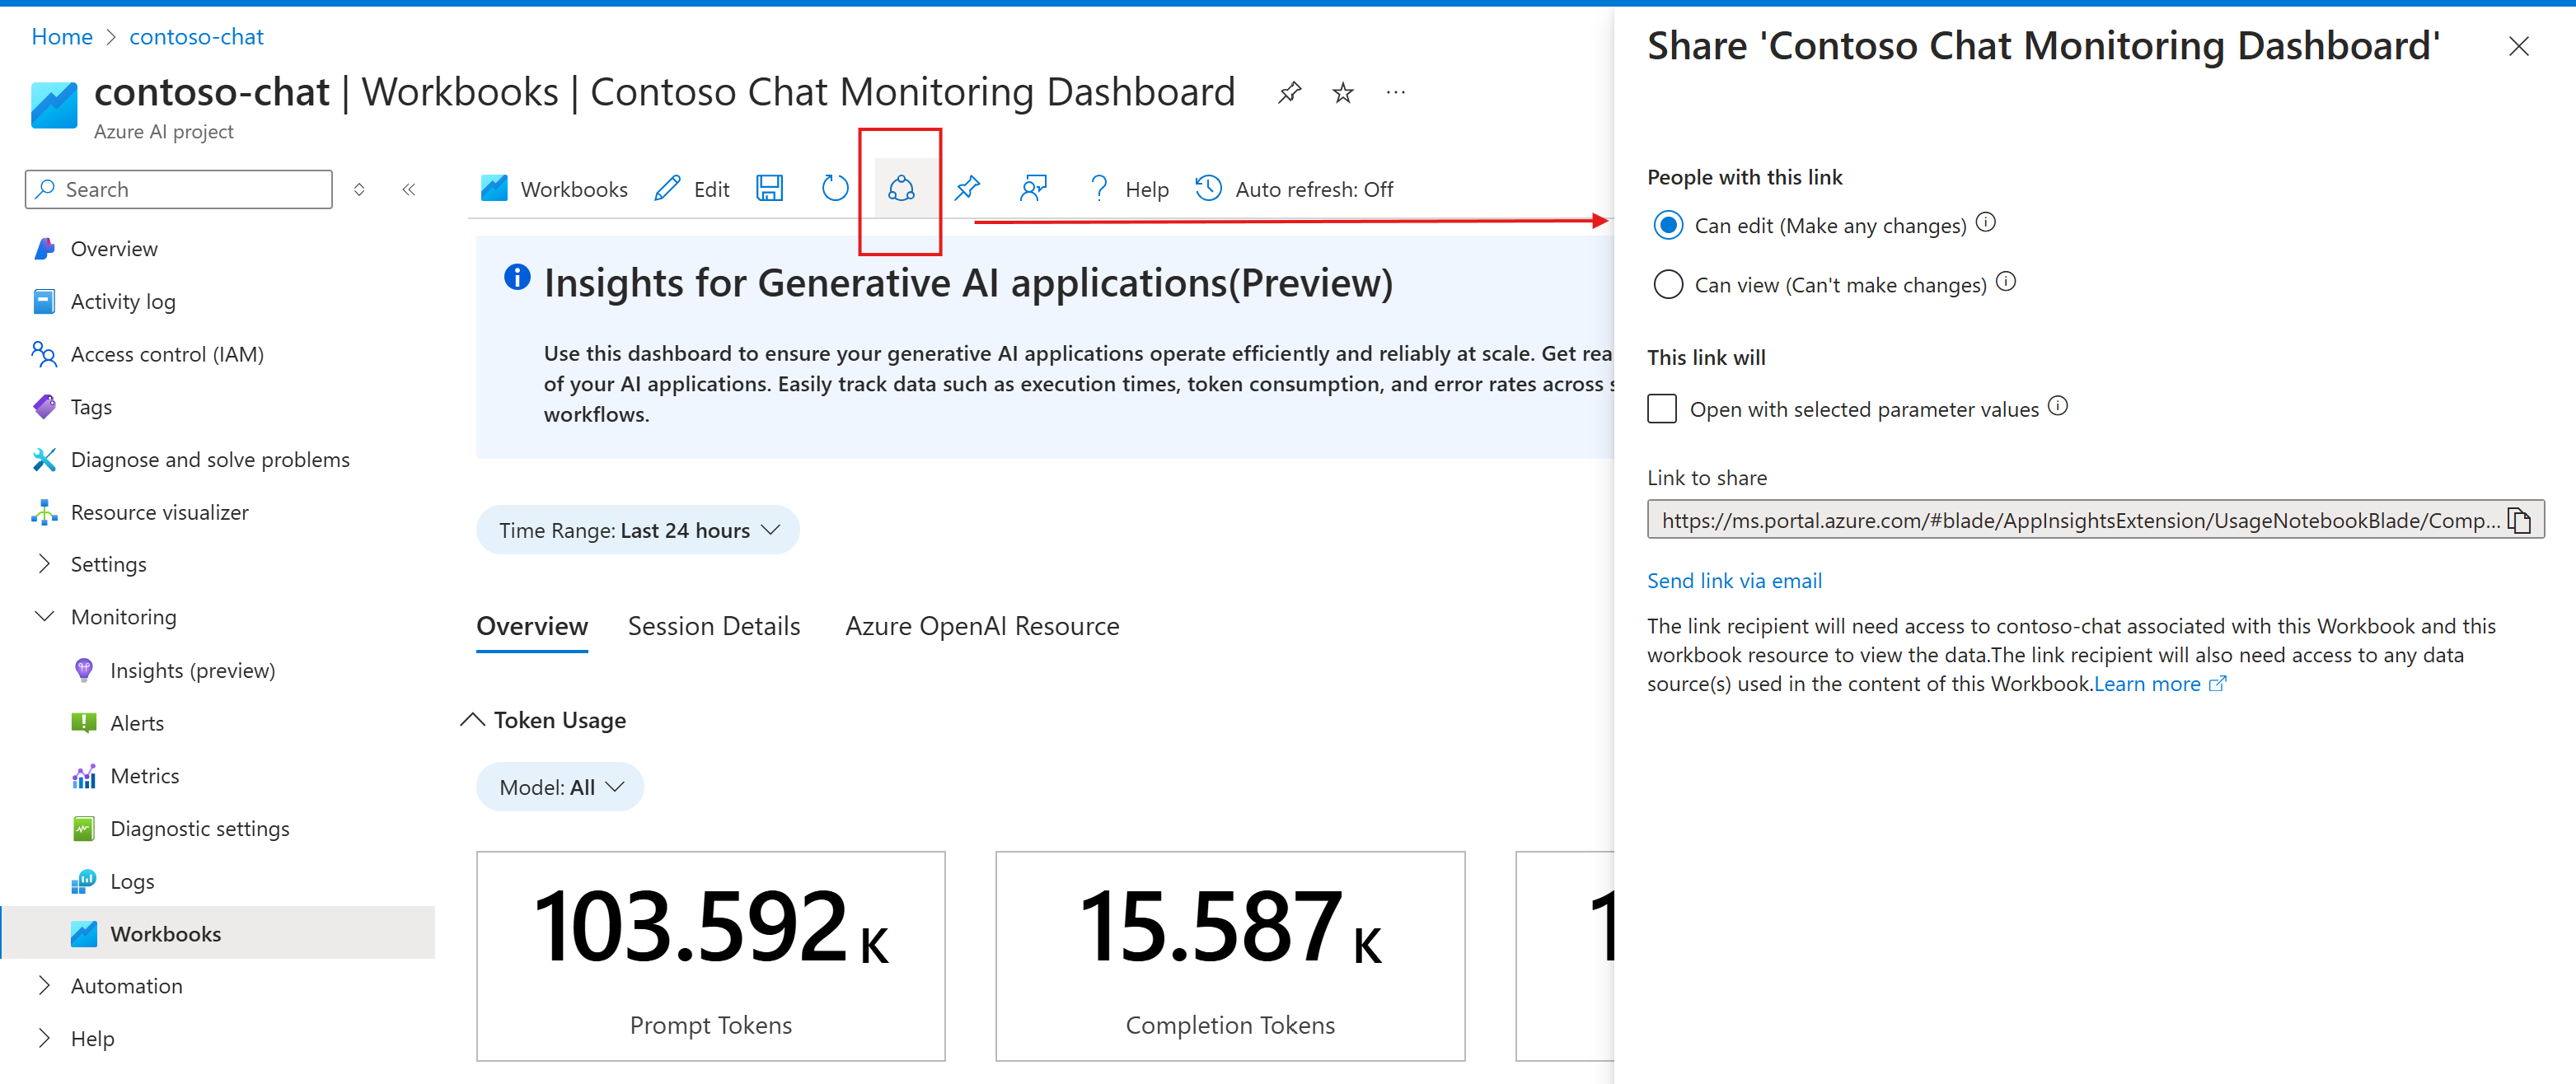
You can also share this workbook with your team so they stay informed with the latest!
Note
When sharing this workbook with your team members, they must have at least 'Reader' role to the connected Application Insights resource to view the displayed information.


